

Automatic 3D cell segmentation of fruit parenchyma tissue from X-ray micro CT images using deep learning
- PMID: 38243306
- PMCID: PMC10799452
- DOI: 10.1186/s13007-024-01137-y
Automatic 3D cell segmentation of fruit parenchyma tissue from X-ray micro CT images using deep learning
Abstract
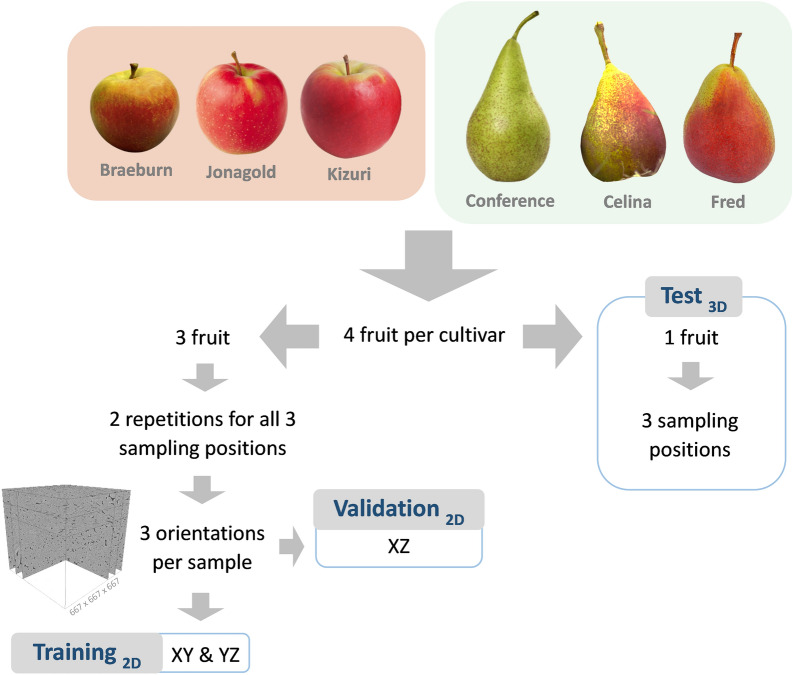
Background: High quality 3D information of the microscopic plant tissue morphology-the spatial organization of cells and intercellular spaces in tissues-helps in understanding physiological processes in a wide variety of plants and tissues. X-ray micro-CT is a valuable tool that is becoming increasingly available in plant research to obtain 3D microstructural information of the intercellular pore space and individual pore sizes and shapes of tissues. However, individual cell morphology is difficult to retrieve from micro-CT as cells cannot be segmented properly due to negligible density differences at cell-to-cell interfaces. To address this, deep learning-based models were trained and tested to segment individual cells using X-ray micro-CT images of parenchyma tissue samples from apple and pear fruit with different cell and porosity characteristics.
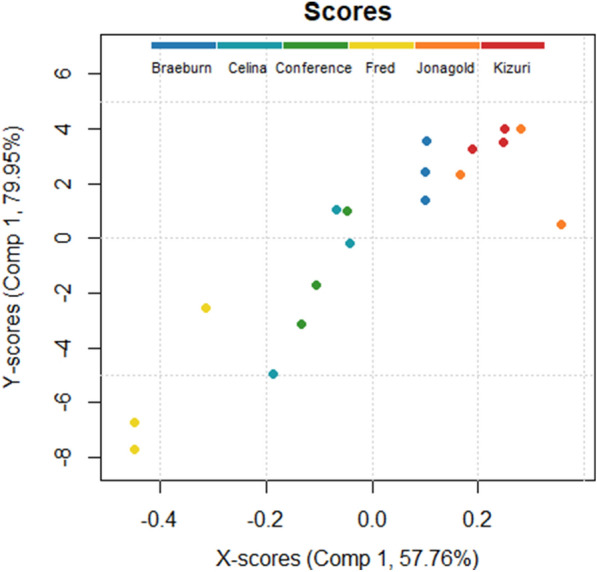
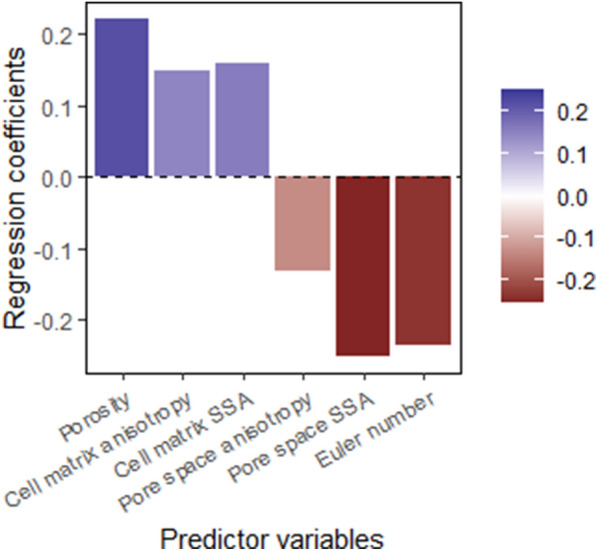
Results: The best segmentation model achieved an Aggregated Jaccard Index (AJI) of 0.86 and 0.73 for apple and pear tissue, respectively, which is an improvement over the current benchmark method that achieved AJIs of 0.73 and 0.67. Furthermore, the neural network was able to detect other plant tissue structures such as vascular bundles and stone cell clusters (brachysclereids), of which the latter were shown to strongly influence the spatial organization of pear cells. Based on the AJIs, apple tissue was found to be easier to segment, as the porosity and specific surface area of the pore space are higher and lower, respectively, compared to pear tissue. Moreover, samples with lower pore network connectivity, proved very difficult to segment.
Conclusions: The proposed method can be used to automatically quantify 3D cell morphology of plant tissue from micro-CT instead of opting for laborious manual annotations or less accurate segmentation approaches. In case fruit tissue porosity or pore network connectivity is too low or the specific surface area of the pore space too high, native X-ray micro-CT is unable to provide proper marker points of cell outlines, and one should rely on more elaborate contrast-enhancing scan protocols.
Keywords: Artificial intelligence; Contrast-enhanced imaging; Fruit physiology; Image processing; Instance segmentation; Plant microstructure; X-ray micro-computed tomography.
© 2024. The Author(s).
Conflict of interest statement
The authors declare that they have no competing interests.
Figures


Similar articles
-
Contrast-enhanced 3D micro-CT of plant tissues using different impregnation techniques.Plant Methods. 2017 Nov 28;13:105. doi: 10.1186/s13007-017-0256-5. eCollection 2017. Plant Methods. 2017. PMID: 29209409 Free PMC article.
-
Automatic analysis of the 3-D microstructure of fruit parenchyma tissue using X-ray micro-CT explains differences in aeration.BMC Plant Biol. 2015 Oct 30;15:264. doi: 10.1186/s12870-015-0650-y. BMC Plant Biol. 2015. PMID: 26518365 Free PMC article.
-
Automatic Segmentation of Multiple Organs on 3D CT Images by Using Deep Learning Approaches.Adv Exp Med Biol. 2020;1213:135-147. doi: 10.1007/978-3-030-33128-3_9. Adv Exp Med Biol. 2020. PMID: 32030668 Review.
-
Deep learning of the sectional appearances of 3D CT images for anatomical structure segmentation based on an FCN voting method.Med Phys. 2017 Oct;44(10):5221-5233. doi: 10.1002/mp.12480. Epub 2017 Aug 31. Med Phys. 2017. PMID: 28730602
-
Three-dimensional visualization of plant tissues and organs by X-ray micro-computed tomography.Microscopy (Oxf). 2023 Aug 4;72(4):310-325. doi: 10.1093/jmicro/dfad026. Microscopy (Oxf). 2023. PMID: 37098215 Review.
Cited by
-
Cellpose as a reliable method for single-cell segmentation of autofluorescence microscopy images.Sci Rep. 2025 Feb 14;15(1):5548. doi: 10.1038/s41598-024-82639-6. Sci Rep. 2025. PMID: 39952935 Free PMC article.
-
Micro computed tomography analysis of barley during the first 24 hours of germination.Plant Methods. 2024 Sep 16;20(1):142. doi: 10.1186/s13007-024-01266-4. Plant Methods. 2024. PMID: 39285284 Free PMC article.
-
Cellpose as a reliable method for single-cell segmentation of autofluorescence microscopy images.bioRxiv [Preprint]. 2024 Jun 10:2024.06.07.597994. doi: 10.1101/2024.06.07.597994. bioRxiv. 2024. Update in: Sci Rep. 2025 Feb 14;15(1):5548. doi: 10.1038/s41598-024-82639-6. PMID: 38915614 Free PMC article. Updated. Preprint.
References
-
- Ho QT, Rogge S, Verboven P, Verlinden BE, Nicolaï BM. Stochastic modelling for virtual engineering of controlled atmosphere storage of fruit. J Food Eng. 2016;176:77–87. doi: 10.1016/j.jfoodeng.2015.07.003. - DOI
-
- Théroux-Rancourt G, Earles JM, Gilbert ME, Zwieniecki MA, Boyce CK, McElrone AJ, et al. The bias of a two-dimensional view: comparing two-dimensional and three-dimensional mesophyll surface area estimates using noninvasive imaging. New Phytol. 2017;215:1609–1622. doi: 10.1111/nph.14687. - DOI - PubMed
Grants and funding
LinkOut - more resources
Full Text Sources
