. 2024 Jan 19;22(1):54.
doi: 10.1186/s12964-023-01464-y.

Faecalibacterium prausnitzii as a potential Antiatherosclerotic microbe

Affiliations

Faecalibacterium prausnitzii as a potential Antiatherosclerotic microbe

Hai-Tao Yang et al. Cell Commun Signal. .

Abstract

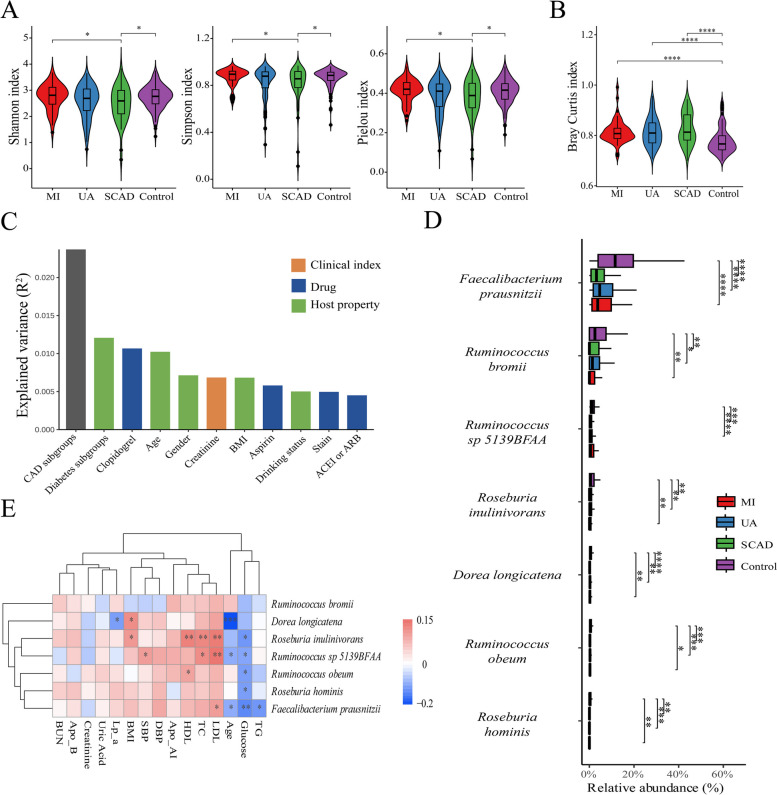
Background: The gut microbiota plays a crucial role in coronary artery disease (CAD) development, but limited attention has been given to the role of the microbiota in preventing this disease. This study aimed to identify key biomarkers using metagenomics and untargeted metabolomics and verify their associations with atherosclerosis.

Methods: A total of 371 participants, including individuals with various CAD types and CAD-free controls, were enrolled. Subsequently, significant markers were identified in the stool samples through gut metagenomic sequencing and untargeted metabolomics. In vivo and in vitro experiments were performed to investigate the mechanisms underlying the association between these markers and atherosclerosis.

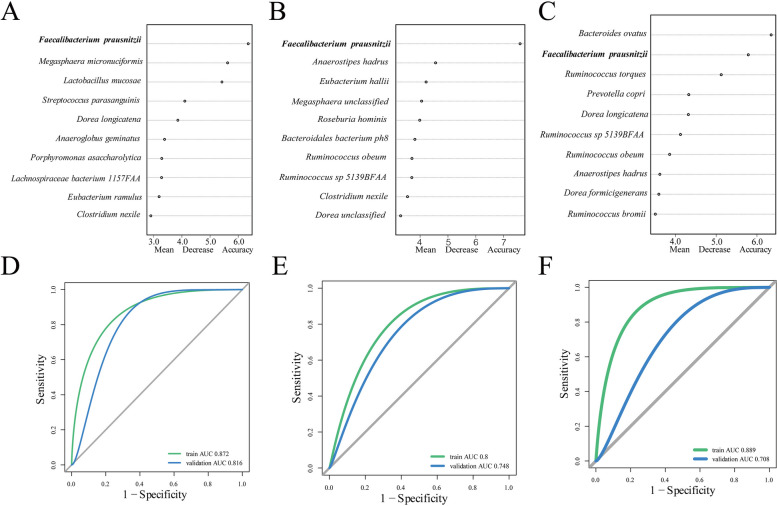
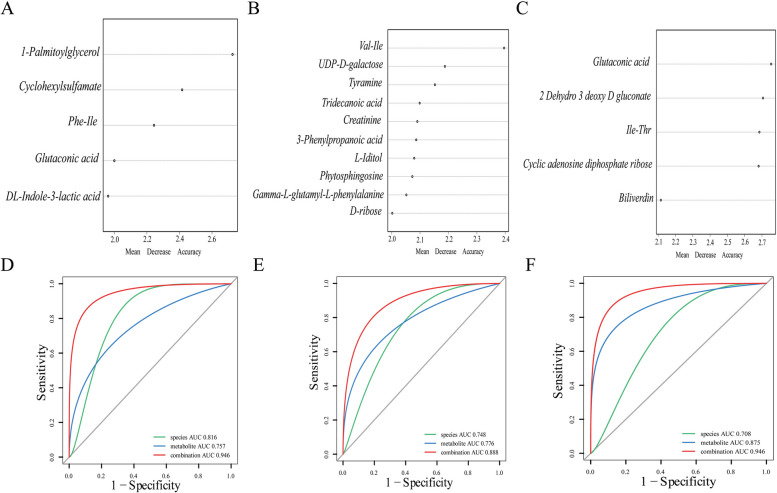
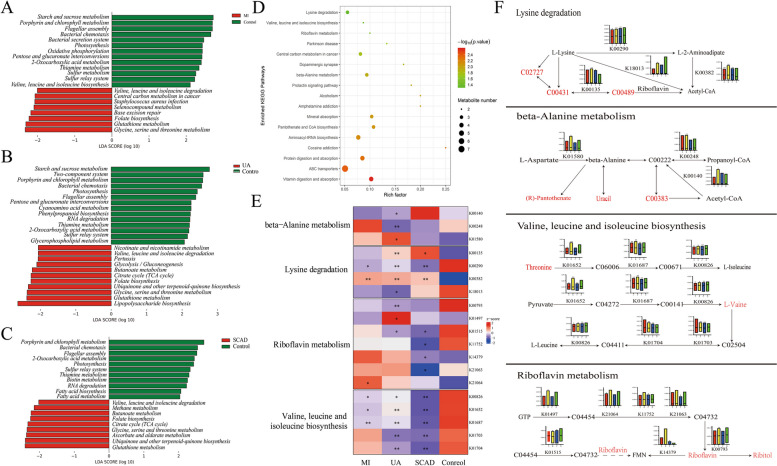
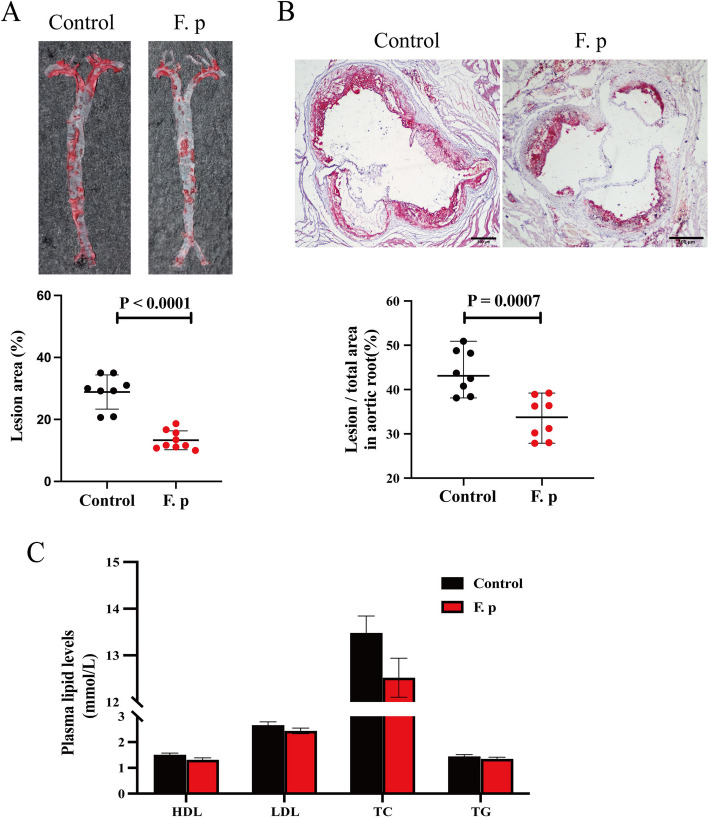
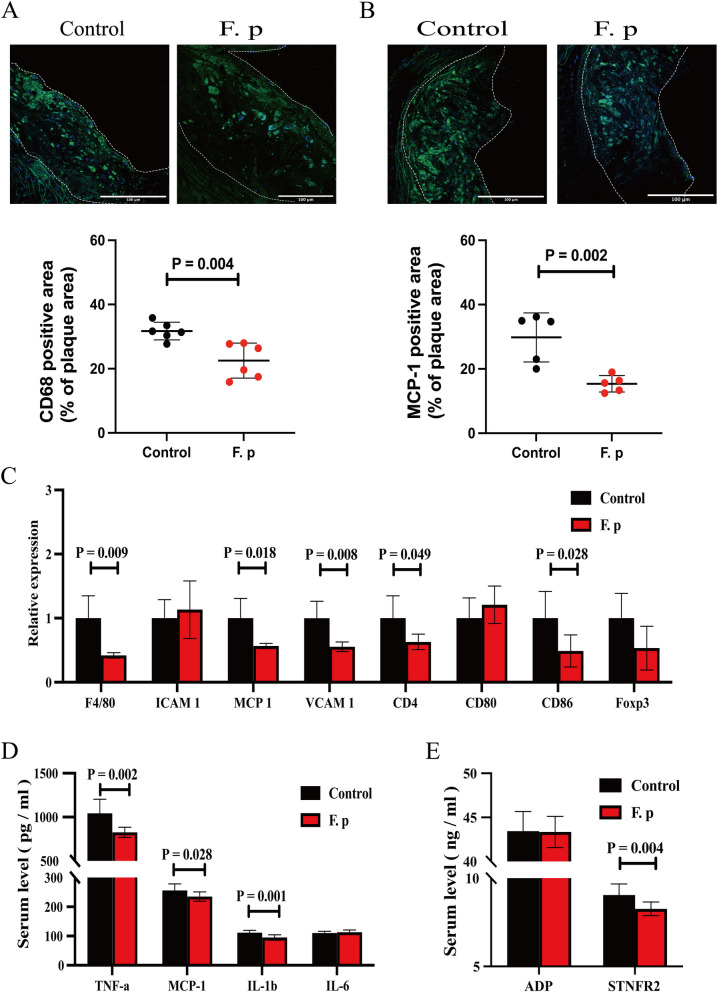
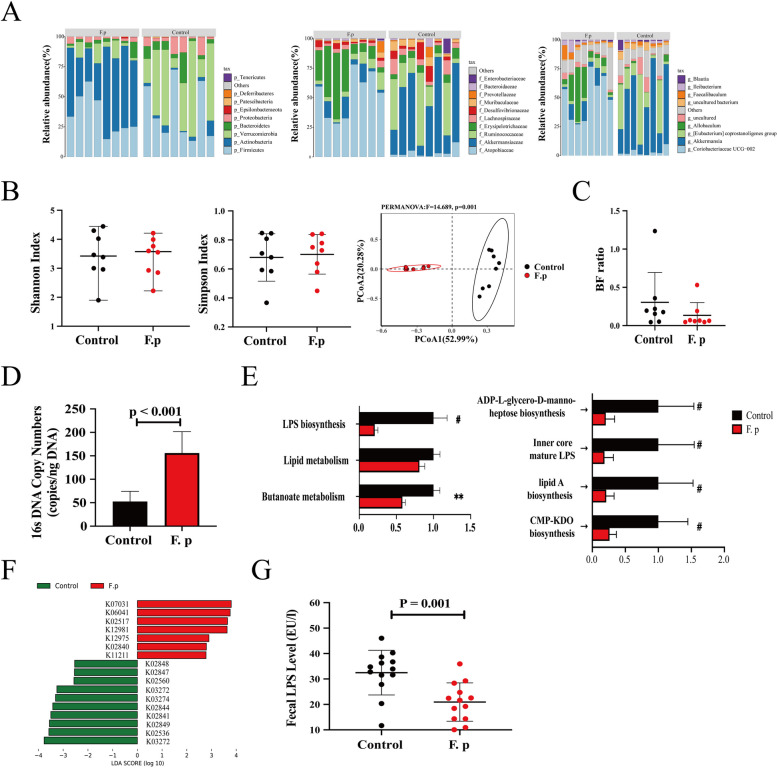
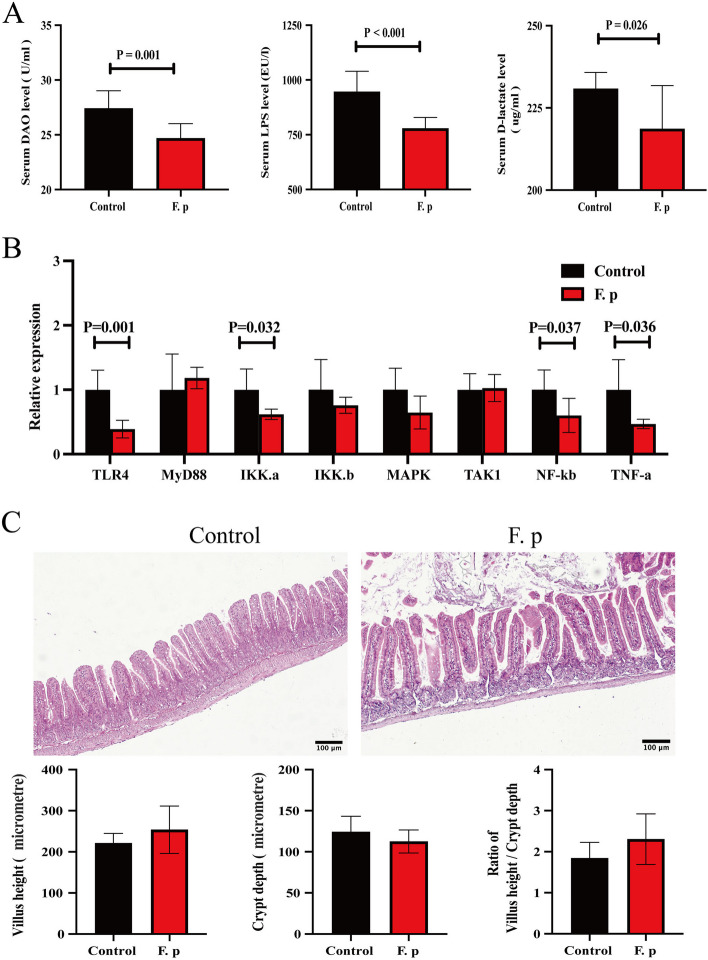
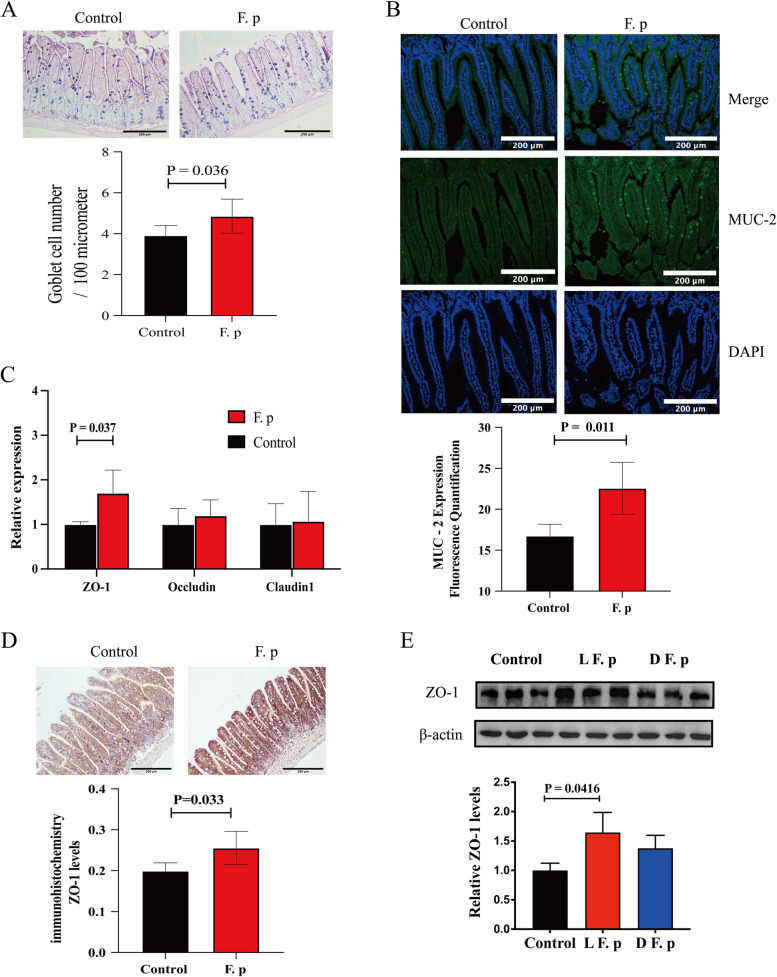
Results: Faecal omics sequencing revealed that individuals with a substantial presence of Faecalibacterium prausnitzii had the lowest incidence of CAD across diverse CAD groups and control subjects. A random forest model confirmed the significant relationship between F. prausnitzii and CAD incidence. Notably, F. prausnitzii emerged as a robust, independent CAD predictor. Furthermore, our findings indicated the potential of the gut microbiota and gut metabolites to predict CAD occurrence and progression, potentially impacting amino acid and vitamin metabolism. F. prausnitzii mitigated inflammation and exhibited an antiatherosclerotic effect on ApoE-/- mice after gavage. This effect was attributed to reduced intestinal LPS synthesis and reinforced mechanical and mucosal barriers, leading to decreased plasma LPS levels and an antiatherosclerotic outcome.

Conclusions: Sequencing of the samples revealed a previously unknown link between specific gut microbiota and atherosclerosis. Treatment with F. prausnitzii may help prevent CAD by inhibiting atherosclerosis.

Keywords: Coronary artery disease; Faecalibacterium prausnitzii; Gut microbiota; Lipopolysaccharide.


Conflict of interest statement

The authors declare no competing interests.

Figures

Fig. 1
Fig. 1
Gut Microbiota Diversity Analysis. a α-Diversity of the gut microbiota at the species level. b β-Diversity of the gut microbiota at the Bray–Curtis distance species level. c Indices affecting the differences in the gut microbiota (p <  0.05) and corresponding contributions (R2). d Differential gut microbiota observed among the various groups. E: Heatmap of the correlation between differentially abundant gut microbiota constituents and clinical indicators. *, P <  0.05; **, P <  0.01; ***, P <  0.001; ****, P <  0.0001
Fig. 2
Fig. 2
Important Biomarkers of Gut Microbes. The included population was randomly divided into a training cohort and a validation cohort. With respect to the training cohort, the random forest model was used to search for important markers. a, b, and c represent the top 10 important gut microbiota constituents in the MI group and the control group, the UA group and the control group, and the SCAD group and the control group, respectively. d, e, and f are the ROC curves for different groups of important gut microbiota constituents in the training cohort and the validation cohort, with the green curve representing the training cohort and the blue curve representing the validation cohort
Fig. 3
Fig. 3
Important Metabolite Biomarkers. The first 5–10 important metabolites between different groups were screened in the validation cohort. a, b, and c represent the MI and control groups, the UA and control groups, and the SCAD and control groups, respectively. d-f In the verification cohort, important gut microbiota and intestinal metabolites were used to construct prediction models of disease between different groups. The green curve represents the gut microbiota, and the blue curve represents intestinal metabolites. The red curve represents the combined analysis of the above two objects
Fig. 4
Fig. 4
CAD-associated changes in gut microbial function and their metabolomic associations. a Comparisons of the relative abundance of KEGG modules between the MI group and control group. b Comparisons of the relative abundance of KEGG modules between the UA group and control group. c Comparisons of the relative abundance of KEGG modules between the SACD group and control group. d Bubble chart of metabolite annotation-related pathways. e The abundance of KO genes involved in representative pathway modules was significantly different in at least one CAD severity group. KO genes with a prevalence of 5% or higher are shown. Significant changes are denoted as follows: *, P <  0.05; **, P <  0.01 according to the Wilcoxon rank sum test. f Changes in gene abundance in (e) are shown in a simplified pathway presentation
Fig. 5
Fig. 5
F. prausnitzii attenuates atherosclerotic lesions. a Representative photomicrographs of oil red O staining and quantitative analysis of the atherosclerotic lesion area in the aortas (8 samples per group). b Representative image of oil red O staining and quantitative analysis of the atherosclerotic lesion area in the aortic sinus (8 samples per group). The black bar represents 500 μm. c Comparison of plasma lipid profiles (12 to 15 samples per group). The data are presented as the mean ± standard error of the mean. All P values were determined by two independent sample t tests
Fig. 6
Fig. 6
F. prausnitzii attenuates local and systemic inflammation. a Representative fluorescence staining of macrophages and quantitative analysis of CD68-positive staining in the aortic sinus (6 samples per group). b Representative fluorescence staining of macrophages and quantitative analysis of MCP-1–positive staining in the aortic sinus (5 samples per group). c mRNA levels in the atherosclerotic aorta. The data were normalized to the housekeeping gene β-actin (6 samples per group). d and e The circulating levels of TNF-α, MCP-1, interleukin-1β (IL-1β), interleukin-6 (IL-6), soluble tumour necrosis factor receptor II (sTNFR II), and adiponectin (ADP) were measured via ELISAs (10 samples per group). The data are presented as the mean ± standard error of the mean. All P values were determined by two independent sample t tests
Fig. 7
Fig. 7
Gavage with F. prausnitzii alters the gut microbial environment (8 samples per group). a Stacking map of the percentage of each species level. b Alpha and beta diversity. c Bacteroidetes-to-Firmicutes (B F) ratio. d Quantification of F. prausnitzii in faeces by qPCR. e Comparison of related pathways according to 16S ribosomal RNA sequencing data analysed using PICRUSt. #:< 0.0001; **:< 0.001. F: Analysis of the KO genes in the LPS pathway. g Faecal LPS levels were detected via ELISAs (13 samples per group). The data are presented as the mean ± standard error of the mean. All P values were determined by two independent sample t tests. **: < 0.01, #: < 0.0001
Fig. 8
Fig. 8
Gut barrier function between the intervention group and control group. a The circulating levels of D-lactate, lipopolysaccharide (LPS) and diamine oxidase (DAO) were measured via ELISAs (9 samples per group). b mRNA levels in the atherosclerotic aorta. The data were normalized to the housekeeping gene β-actin (5 samples per group). c Representative haematoxylin-eosin staining of the ileum and quantitative analysis of haematoxylin-eosin staining in the ileum (7 samples per group). The black bar represents 100 μm. The data are presented as the mean ± standard error of the mean. All P values were determined by two independent sample t tests
Fig. 9
Fig. 9
Intestinal mucus barrier and mechanical barrier properties of the intervention group and control group. a Representative Alcian blue-periodic acid-Schiff staining of the ileum and quantitative analysis of Alcian blue-periodic acid-Schiff staining in the ileum (6 samples per group). b Representative sections and quantitative analysis of MUC-2 in the small intestine (5 samples per group). c mRNA levels in the small intestine. The data were normalized to the housekeeping gene β-actin (5 samples per group). d Representative sections and quantitative analysis of ZO-1 in the small intestine (5 to 6 samples per group). e Comparison of ZO-1 protein levels among the live F. prausnitzii group (LF. p), inactivated F. prausnitzii (DF. p) group and control group after cell model intervention. The white/black bar represents 500 μm. The data are presented as the mean ± standard error of the mean. All P values were determined by two independent sample t tests

Similar articles

Cited by

References

    1. The Writing Committee of the Report on Cardiovascular Health and Diseases in China. Report on Cardiovascular Health and Diseases Burden in China: an Updated Summary of 2020. Chinese Circulation Journal. 2021;36(6) Serial No.276
    1. Xu H, Yang Y, Wang C, et al. Association of Hospital-Level Differences in care with outcomes among patients with acute ST-segment elevation myocardial infarction in China. JAMA Netw Open. 2020;3(10):e2021677. doi: 10.1001/jamanetworkopen.2020.21677. - DOI - PMC - PubMed
    1. Lenoir M, Martín R, Torres-Maravilla E, et al. Butyrate mediates anti-inflammatory effects of Faecalibacterium prausnitzii in intestinal epithelial cells through Dact3. Gut Microbes. 2020;12(1):1–16. doi: 10.1080/19490976.2020.1826748. - DOI - PMC - PubMed
    1. Li HB, Xu ML, Xu XD, et al. Faecalibacterium prausnitzii Attenuates CKD via Butyrate-Renal GPR43 Axis. Circ Res. 2022;131(9):e120–e134. doi: 10.1161/CIRCRESAHA.122.320184. - DOI - PMC - PubMed
    1. Khan TJ, Ahmed YM, Zamzami MA, et al. Atorvastatin treatment modulates the gut microbiota of the Hypercholesterolemic patients. OMICS. 2018;22(2):154–163. doi: 10.1089/omi.2017.0130. - DOI - PubMed

Publication types

Substances