

The genomic alterations in glioblastoma influence the levels of CSF metabolites
- PMID: 38243318
- PMCID: PMC10799404
- DOI: 10.1186/s40478-024-01722-1
The genomic alterations in glioblastoma influence the levels of CSF metabolites
Abstract
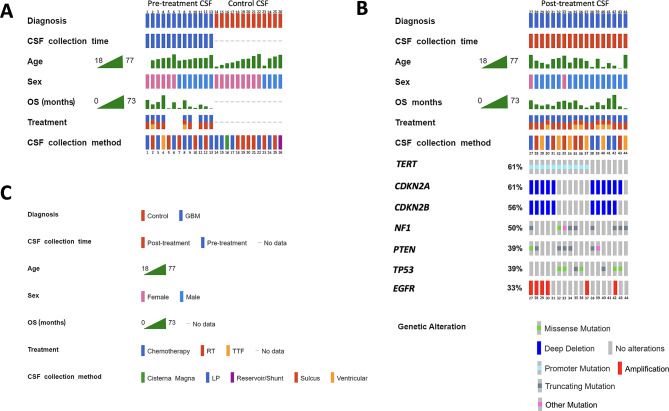
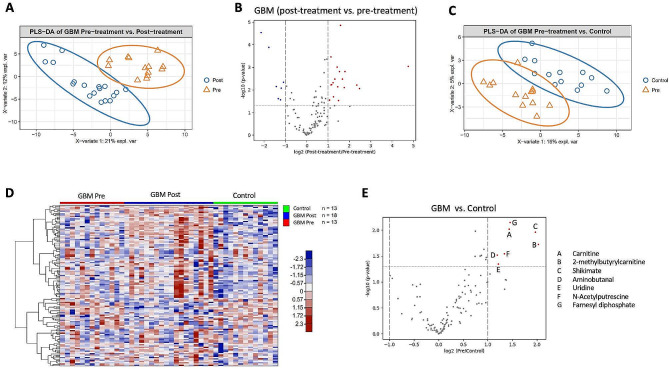
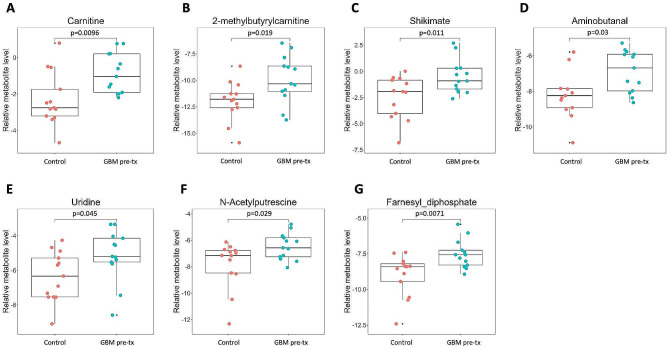
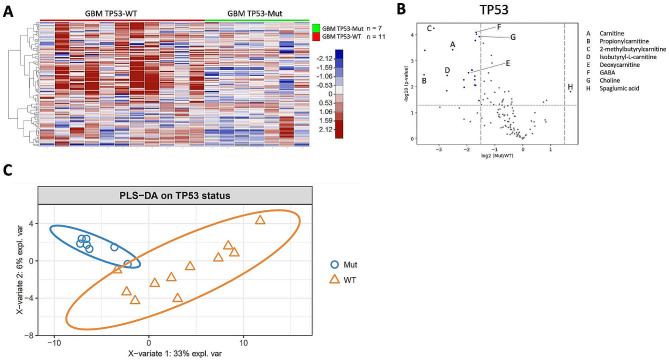
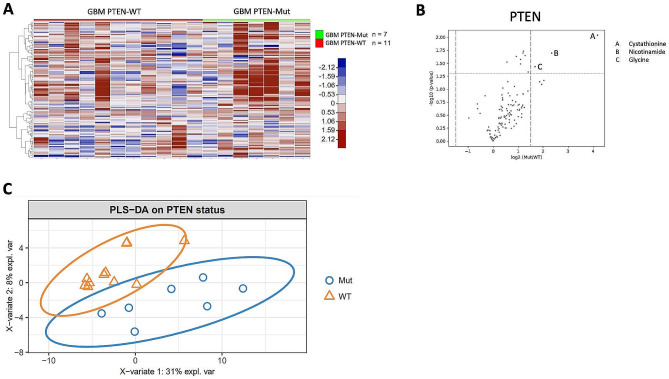
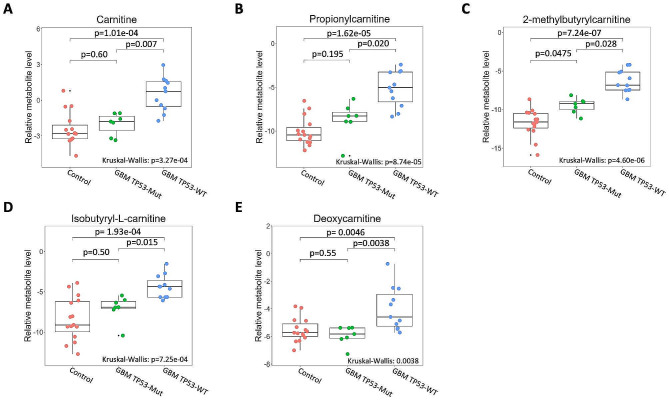
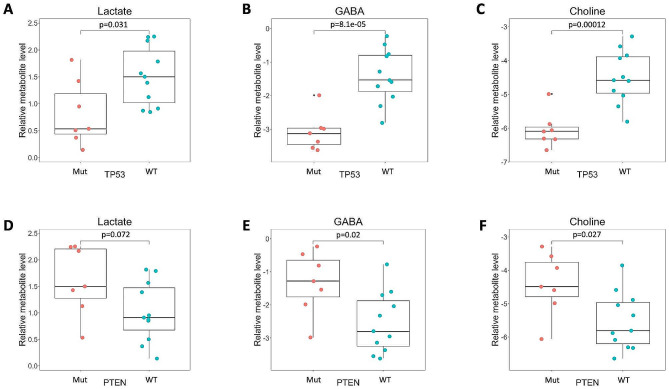
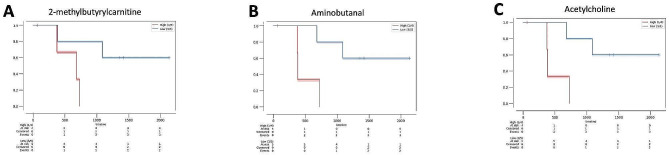
Cerebrospinal fluid (CSF) analysis is underutilized in patients with glioblastoma (GBM), partly due to a lack of studies demonstrating the clinical utility of CSF biomarkers. While some studies show the utility of CSF cell-free DNA analysis, studies analyzing CSF metabolites in patients with glioblastoma are limited. Diffuse gliomas have altered cellular metabolism. For example, mutations in isocitrate dehydrogenase enzymes (e.g., IDH1 and IDH2) are common in diffuse gliomas and lead to increased levels of D-2-hydroxyglutarate in CSF. However, there is a poor understanding of changes CSF metabolites in GBM patients. In this study, we performed targeted metabolomic analysis of CSF from n = 31 patients with GBM and n = 13 individuals with non-neoplastic conditions (controls), by mass spectrometry. Hierarchical clustering and sparse partial least square-discriminant analysis (sPLS-DA) revealed differences in CSF metabolites between GBM and control CSF, including metabolites associated with fatty acid oxidation and the gut microbiome (i.e., carnitine, 2-methylbutyrylcarnitine, shikimate, aminobutanal, uridine, N-acetylputrescine, and farnesyl diphosphate). In addition, we identified differences in CSF metabolites in GBM patients based on the presence/absence of TP53 or PTEN mutations, consistent with the idea that different mutations have different effects on tumor metabolism. In summary, our results increase the understanding of CSF metabolites in patients with diffuse gliomas and highlight several metabolites that could be informative biomarkers in patients with GBM.
Keywords: Biomarker; CSF; Carnitine; Cerebrospinal fluid; Choline; GABA; Glioblastoma; Lactate; Metabolomics; PTEN; Shikimate; TP53.
© 2024. The Author(s).
Conflict of interest statement
The authors declare that they have no competing interests.
Figures
Similar articles
-
Diagnostic utility of genetic alterations in distinguishing IDH-wildtype glioblastoma from lower-grade gliomas: Insight from next-generation sequencing analysis of 479 cases.Brain Pathol. 2024 Sep;34(5):e13234. doi: 10.1111/bpa.13234. Epub 2024 Jan 12. Brain Pathol. 2024. PMID: 38217295 Free PMC article.
-
Diagnostic test accuracy and cost-effectiveness of tests for codeletion of chromosomal arms 1p and 19q in people with glioma.Cochrane Database Syst Rev. 2022 Mar 2;3(3):CD013387. doi: 10.1002/14651858.CD013387.pub2. Cochrane Database Syst Rev. 2022. PMID: 35233774 Free PMC article.
-
Deep learning-based IDH1 gene mutation prediction using histopathological imaging and clinical data.Comput Biol Med. 2024 Sep;179:108902. doi: 10.1016/j.compbiomed.2024.108902. Epub 2024 Jul 21. Comput Biol Med. 2024. PMID: 39038392
-
Treatment options for progression or recurrence of glioblastoma: a network meta-analysis.Cochrane Database Syst Rev. 2021 May 4;5(1):CD013579. doi: 10.1002/14651858.CD013579.pub2. Cochrane Database Syst Rev. 2021. PMID: 34559423 Free PMC article.
-
Pediatric-type high-grade gliomas with PDGFRA amplification in adult patients with Li-Fraumeni syndrome: clinical and molecular characterization of three cases.Acta Neuropathol Commun. 2024 Apr 11;12(1):57. doi: 10.1186/s40478-024-01762-7. Acta Neuropathol Commun. 2024. PMID: 38605367 Free PMC article.
Cited by
-
Metabolic Alterations in Human Post-Mortem Frontal Cortex and Cerebrospinal Fluid Associated With High Levels of Nicotine Metabolite Cotinine.Addict Biol. 2025 Jun;30(6):e70064. doi: 10.1111/adb.70064. Addict Biol. 2025. PMID: 40539563 Free PMC article.
-
MetaWise: Combined Feature Selection and Weighting Method to Link the Serum Metabolome to Treatment Response and Survival in Glioblastoma.Int J Mol Sci. 2024 Oct 11;25(20):10965. doi: 10.3390/ijms252010965. Int J Mol Sci. 2024. PMID: 39456748 Free PMC article.
-
Gut microbiota and their influence in brain cancer milieu.J Neuroinflammation. 2025 May 1;22(1):129. doi: 10.1186/s12974-025-03434-2. J Neuroinflammation. 2025. PMID: 40312370 Free PMC article. Review.
-
From Biomarker Discovery to Clinical Applications of Metabolomics in Glioblastoma.Metabolites. 2025 Apr 29;15(5):295. doi: 10.3390/metabo15050295. Metabolites. 2025. PMID: 40422872 Free PMC article. Review.
-
Metabolic Contrasts: Fatty Acid Oxidation and Ketone Bodies in Healthy Brains vs. Glioblastoma Multiforme.Int J Mol Sci. 2024 May 17;25(10):5482. doi: 10.3390/ijms25105482. Int J Mol Sci. 2024. PMID: 38791520 Free PMC article. Review.
References
-
- Ballester LY, Lu G, Zorofchian S, Vantaku V, Putluri V, Yan Y, Arevalo O, Zhu P, Riascos RF, Sreekumar A et al (2018) Analysis of cerebrospinal fluid metabolites in patients with primary or metastatic central nervous system tumors. Acta Neuropathol Commun 6: 85 10.1186/s40478-018-0588-z - PMC - PubMed
Publication types
MeSH terms
Substances
Grants and funding
LinkOut - more resources
Full Text Sources
Medical
Research Materials
Miscellaneous
