. 2024 Jan 19;16(1):16.
doi: 10.1186/s13073-024-01285-9.

Gut microbiome for predicting immune checkpoint blockade-associated adverse events

Affiliations

Gut microbiome for predicting immune checkpoint blockade-associated adverse events

Muni Hu et al. Genome Med. .

Abstract

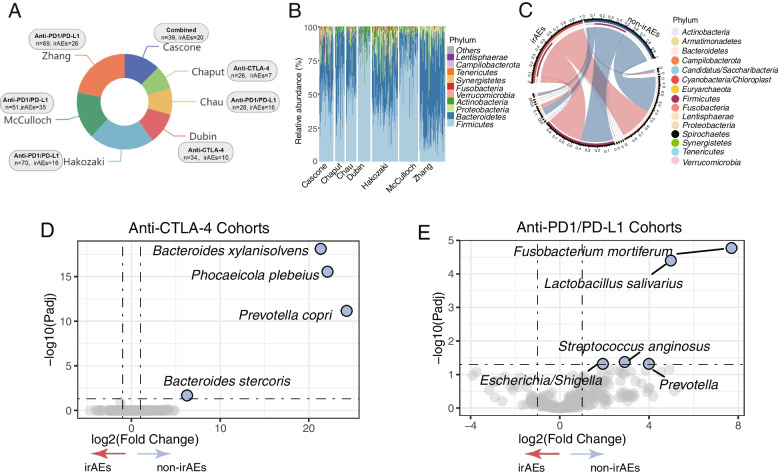
Background: The impact of the gut microbiome on the initiation and intensity of immune-related adverse events (irAEs) prompted by immune checkpoint inhibitors (ICIs) is widely acknowledged. Nevertheless, there is inconsistency in the gut microbial associations with irAEs reported across various studies.

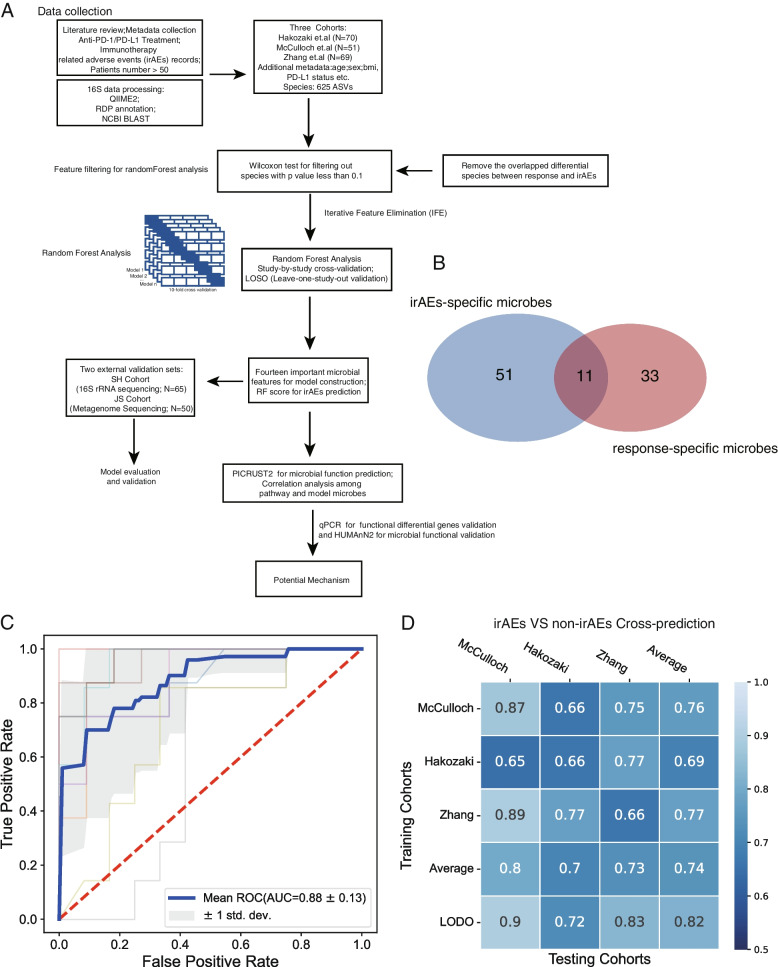
Methods: We performed a comprehensive analysis leveraging a dataset that included published microbiome data (n = 317) and in-house generated data from 16S rRNA and shotgun metagenome samples of irAEs (n = 115). We utilized a machine learning-based approach, specifically the Random Forest (RF) algorithm, to construct a microbiome-based classifier capable of distinguishing between non-irAEs and irAEs. Additionally, we conducted a comprehensive analysis, integrating transcriptome and metagenome profiling, to explore potential underlying mechanisms.

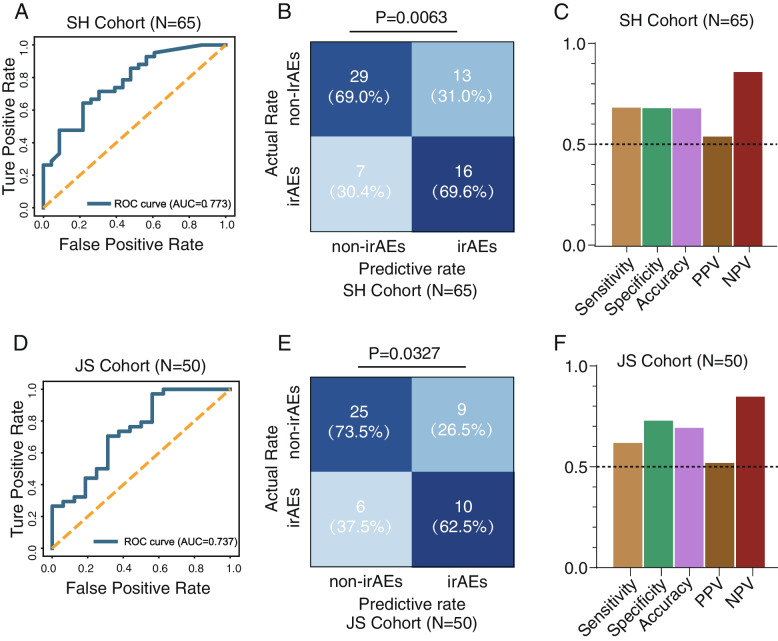
Results: We identified specific microbial species capable of distinguishing between patients experiencing irAEs and non-irAEs. The RF classifier, developed using 14 microbial features, demonstrated robust discriminatory power between non-irAEs and irAEs (AUC = 0.88). Moreover, the predictive score from our classifier exhibited significant discriminative capability for identifying non-irAEs in two independent cohorts. Our functional analysis revealed that the altered microbiome in non-irAEs was characterized by an increased menaquinone biosynthesis, accompanied by elevated expression of rate-limiting enzymes menH and menC. Targeted metabolomics analysis further highlighted a notably higher abundance of menaquinone in the serum of patients who did not develop irAEs compared to the irAEs group.

Conclusions: Our study underscores the potential of microbial biomarkers for predicting the onset of irAEs and highlights menaquinone, a metabolite derived from the microbiome community, as a possible selective therapeutic agent for modulating the occurrence of irAEs.

Keywords: Gut microbiome; Immune checkpoint inhibitors; Immune-related adverse events; Programmed death 1 (PD-1)/programmed death ligand 1 (PD-L1).


Conflict of interest statement

The authors declare that they have no competing interests.

Figures

Fig. 1
Fig. 1
Study characteristics and microbiota composition difference in different irAEs status. A Study characteristics and demographic proportion of irAEs. B Microbiota composition (Phylum level) in the different studies of individuals. C Microbiota composition (Phylum level) in the different irAEs status analyzed with all cohorts demonstrated in 1A. D Visualization of differential microbiota in anti-CTLA-4 cohorts (Dubin and Chaput) by volcano plot. E Visualization of differential microbiota in anti-PD-1/PD-L1 cohorts (Zhang, Hakozaki, Chau, and McCulloch) by volcano plot
Fig. 2
Fig. 2
Alterations of gut microbial composition with different irAEs status among three anti-PD-1/PD-L1 cohorts. A Variance explained by irAEs status (irAEs versus non-irAEs) is plotted against variance explained by study effects for individual ASVs. The significantly differential ASVs are colored in red and the dot size is proportional to the abundance of each ASV. P values were from a two-sided blocked Wilcoxon rank-sum test. B Relative abundance of bacterial phyla in irAEs and non-irAEs across all three different studies. C Alpha diversity analysis calculated with Fisher alpha, Richness, Shannon, and Simpson indexes. D Principal coordinate analysis of samples (irAEs: n = 77; non-irAEs: n = 113) from all three anti-PD-1 studies based on Bray–Curtis distance. P values of beta diversity based on Bray–Curtis distance were calculated with PERMANOVA. The study is color-coded and the group (irAEs and non-irAEs) is indicated by different shapes. The upper-right and the bottom-left boxplots illustrate that samples projected onto the first two principal coordinates broken down by study and disease status, respectively. P values of the first and second principal components were calculated with a two-sided Kruskal–Wallis test for study and group. All boxplots represent the 25th–75th percentile of the distribution; the median is shown in a thick line at the middle of the box; the whiskers extend up to values within 1.5 times of IQR, and outliers are represented as dots. The anti-PD1/PD-L1 cohorts comprising over 50 patients, such as those led by Zhang et al., Hakozaki et al., and McCulloch et al., were utilized for the analysis in this part
Fig. 3
Fig. 3
Model construction and performance. A Flow chart for microbial model construction. B Venn diagram shows the overlap of important microbiota assigned at species level between irAEs and response. C The AUC of the optimized models constructed with the most important microbiota for distinguishing non-irAEs from irAEs. Mean AUC and standard deviation of stratified tenfold cross-validation were shown. For each AUC detailed: “ROC Fold 1 (AUC = 0.89),” “ROC Fold 2 (AUC = 0.93),” “ROC Fold 3 (AUC = 0.97),” “ROC Fold 4 (AUC = 1.00),” “ROC Fold 5 (AUC = 0.94),” “ROC Fold 6 (AUC = 0.97),” “ROC Fold 7 (AUC = 0.91),” “ROC Fold 8 (AUC = 0.57),” “ROC Fold 9 (AUC = 0.71),” “ROC Fold 10 (AUC = 0.95).” D Prediction performance of important features using study-by-study and leave-one-study-out (LOSO) validation. The heatmap shows the area under the receiver operating characteristic curve (AUROC) from cross-validations within each study (blue boxes along the diagonal) and study-to-study model transfer (external-validations off-diagonal). The last column shows the average AUROC for study-to-study predictions. The bottom line shows the AUROC for a model trained on all studies but one (LOSO validation)
Fig. 4
Fig. 4
Identification of minimal features for the best model performance and multiple metrics for model evaluation. A Average AUC of ten-fold Random Forest cross-validation, study-to-study transfer validation classifiers, and LOSO validation for non-irAEs versus irAEs with a different number of features. B Comparison of RF score distributions calculated by RF14 classifier between non-irAEs (n = 113) and irAEs (n = 77) groups. Two-sided P values were calculated using the Wilcoxon rank-sum test. C Performance measurements of RF14 classifier illustrated by sensitivity, specificity, accuracy, positive predictive value (PPV), and negative predictive value (NPV). D The comparison of microbiome model specificity between irAEs and response. The anti-PD1/PD-L1 cohorts comprising over 50 patients, such as those led by Zhang et al., Hakozaki et al., and McCulloch et al., were utilized for the analysis in this part
Fig. 5
Fig. 5
External validation cohorts and evaluation metrics for microbiome model. A Receiver operating characteristic (ROC) curves for the validation of microbiome model using SH amplicon cohort (n = 65). B Statistical analysis was conducted based on the predictive value and actual value of irAEs using the optimal thresholds of RF score defined in the training cohort from SH amplicon cohort (n = 65), chi-square test. C Performance measurements of RF14 classifier for SH cohort illustrated by sensitivity, specificity, accuracy, positive predictive value (PPV), and negative predictive value (NPV). D Receiver operating characteristic (ROC) curves for the validation of microbiome model using JS metagenome cohort (n = 50). E Statistical analysis was conducted based on the predictive value and actual value of irAEs using the cut-off value of RF score defined in the training cohort from JS metagenome cohort (n = 50), chi-square test. F Performance measurements of RF14 classifier for JS cohort illustrated by sensitivity, specificity, accuracy, positive predictive value (PPV), and negative predictive value (NPV)
Fig. 6
Fig. 6
Microbial functional alterations in irAEs and non-irAEs. A Differentially abundant pathways were plotted; P values were computed using a two-sided blocked Wilcoxon rank-sum test and the FDR < 0.005 were presented in the heatmap. B The correlation between the abundance of menaquinone biosynthesis-related pathway and model species. Spearman’s correlation between the abundance of menaquinone biosynthesis and 14 representative microbial species in the classifiers and edge width corresponds to the Spearman’s r statistic and edge color denotes the statistical significance. r, Spearman correlation coefficient; with a color-gradient denoting Spearman’s correlation coefficients, and the exact values were described in heatmap frames. C, D Plotted values are qRT-PCR quantifications of bacterial genes in menaquinone biosynthesis. The abundances of menC (C) and menH (D) were compared between non-irAEs (n = 17) and irAEs (n = 11) groups. All boxes extend from 25 to 75th percentiles and whiskers show the minimum and maximum values. Lines at the middle of each box show the median. P values were computed using a two-sided Wilcoxon rank-sum test. EM Shotgun metagenome functional validation (N = 50) for differential genes menC (E), menH (F), and menaquinone biosynthesis pathway (GM). All boxes extend from 25 to 75th percentiles and whiskers show the minimum and maximum values. Lines at the middle of each box show the median. P values were computed using a two-sided Wilcoxon rank-sum test. O Blood concentration comparison of menaquinone-6 (MK-6) between patients with irAEs( N = 10) and patients without irAEs(N = 10). Statistical significance was assessed using a two-sided Wilcoxon rank-sum test

References

    1. Waldman AD, Fritz JM, Lenardo MJ. A guide to cancer immunotherapy: from T cell basic science to clinical practice. Nat Rev Immunol. 2020;20:651–668. doi: 10.1038/s41577-020-0306-5. - DOI - PMC - PubMed
    1. Couzin-Frankel J. Breakthrough of the year 2013. Cancer immunotherapy. Science. 2013;342:1432–1433. doi: 10.1126/science.342.6165.1432. - DOI - PubMed
    1. Topalian SL, et al. Safety, activity, and immune correlates of anti-PD-1 antibody in cancer. N Engl J Med. 2012;366:2443–2454. doi: 10.1056/NEJMoa1200690. - DOI - PMC - PubMed
    1. Topalian SL, Drake CG, Pardoll DM. Immune checkpoint blockade: a common denominator approach to cancer therapy. Cancer Cell. 2015;27:450–461. doi: 10.1016/j.ccell.2015.03.001. - DOI - PMC - PubMed
    1. Baxi S, et al. Immune-related adverse events for anti-PD-1 and anti-PD-L1 drugs: systematic review and meta-analysis. BMJ. 2018;360:k793. doi: 10.1136/bmj.k793. - DOI - PMC - PubMed

Publication types

MeSH terms

Substances