

DESpace: spatially variable gene detection via differential expression testing of spatial clusters
- PMID: 38243704
- PMCID: PMC10868334
- DOI: 10.1093/bioinformatics/btae027
DESpace: spatially variable gene detection via differential expression testing of spatial clusters
Abstract
Motivation: Spatially resolved transcriptomics (SRT) enables scientists to investigate spatial context of mRNA abundance, including identifying spatially variable genes (SVGs), i.e. genes whose expression varies across the tissue. Although several methods have been proposed for this task, native SVG tools cannot jointly model biological replicates, or identify the key areas of the tissue affected by spatial variability.
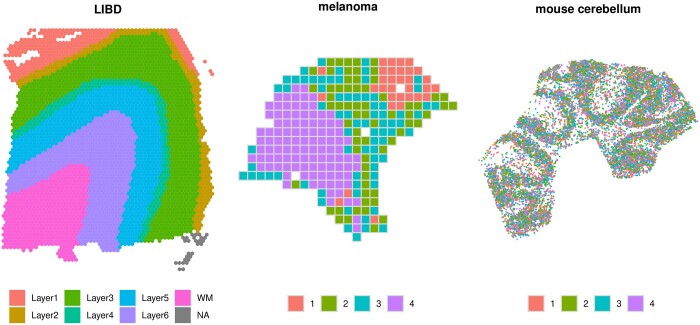
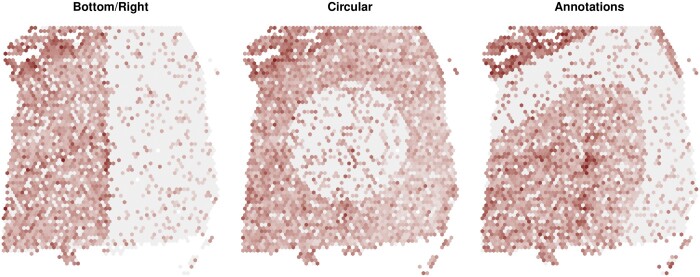
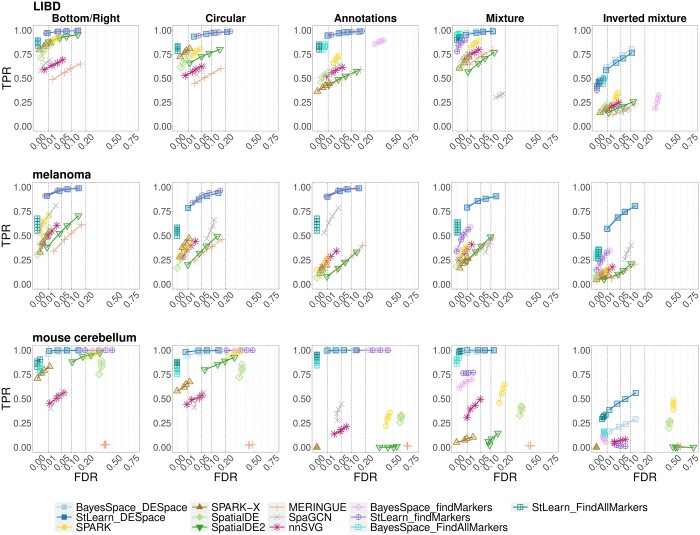
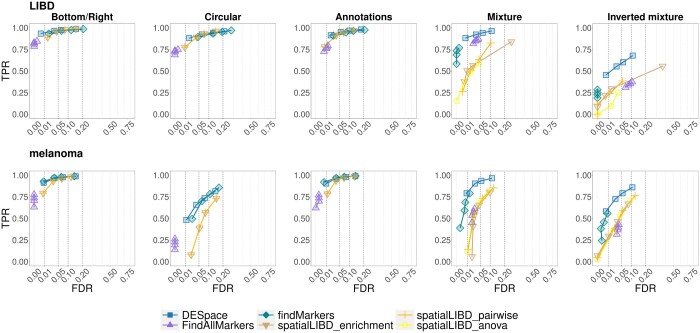
Results: Here, we introduce DESpace, a framework, based on an original application of existing methods, to discover SVGs. In particular, our approach inputs all types of SRT data, summarizes spatial information via spatial clusters, and identifies spatially variable genes by performing differential gene expression testing between clusters. Furthermore, our framework can identify (and test) the main cluster of the tissue affected by spatial variability; this allows scientists to investigate spatial expression changes in specific areas of interest. Additionally, DESpace enables joint modeling of multiple samples (i.e. biological replicates); compared to inference based on individual samples, this approach increases statistical power, and targets SVGs with consistent spatial patterns across replicates. Overall, in our benchmarks, DESpace displays good true positive rates, controls for false positive and false discovery rates, and is computationally efficient.
Availability and implementation: DESpace is freely distributed as a Bioconductor R package at https://bioconductor.org/packages/DESpace.
© The Author(s) 2024. Published by Oxford University Press.
Conflict of interest statement
No competing interest is declared.
Figures

Similar articles
-
Addressing the mean-variance relationship in spatially resolved transcriptomics data with spoon.Biostatistics. 2024 Dec 31;26(1):kxaf012. doi: 10.1093/biostatistics/kxaf012. Biostatistics. 2024. PMID: 40515599 Free PMC article.
-
Benchmarking computational methods for detecting spatial domains and domain-specific spatially variable genes from spatial transcriptomics data.Nucleic Acids Res. 2025 Apr 10;53(7):gkaf303. doi: 10.1093/nar/gkaf303. Nucleic Acids Res. 2025. PMID: 40240000 Free PMC article.
-
Benchmarking algorithms for spatially variable gene identification in spatial transcriptomics.Bioinformatics. 2025 Mar 29;41(4):btaf131. doi: 10.1093/bioinformatics/btaf131. Bioinformatics. 2025. PMID: 40139667 Free PMC article.
-
SpaceX: gene co-expression network estimation for spatial transcriptomics.Bioinformatics. 2022 Nov 15;38(22):5033-5041. doi: 10.1093/bioinformatics/btac645. Bioinformatics. 2022. PMID: 36179087 Free PMC article.
-
Recent advances in spatially variable gene detection in spatial transcriptomics.Comput Struct Biotechnol J. 2024 Feb 2;23:883-891. doi: 10.1016/j.csbj.2024.01.016. eCollection 2024 Dec. Comput Struct Biotechnol J. 2024. PMID: 38370977 Free PMC article. Review.
Cited by
-
Categorization of 33 computational methods to detect spatially variable genes from spatially resolved transcriptomics data.ArXiv [Preprint]. 2024 Oct 3:arXiv:2405.18779v4. ArXiv. 2024. Update in: Nat Commun. 2025 Jan 29;16(1):1141. doi: 10.1038/s41467-025-56080-w. PMID: 38855546 Free PMC article. Updated. Preprint.
-
Synthetic control removes spurious discoveries from double dipping in single-cell and spatial transcriptomics data analyses.bioRxiv [Preprint]. 2024 Dec 30:2023.07.21.550107. doi: 10.1101/2023.07.21.550107. bioRxiv. 2024. PMID: 37546812 Free PMC article. Preprint.
-
Categorization of 34 computational methods to detect spatially variable genes from spatially resolved transcriptomics data.Nat Commun. 2025 Jan 29;16(1):1141. doi: 10.1038/s41467-025-56080-w. Nat Commun. 2025. PMID: 39880807 Free PMC article. Review.
References
-
- Chen A, Liao S, Cheng M et al. Spatiotemporal transcriptomic atlas of mouse organogenesis using DNA nanoball-patterned arrays. Cell 2022;185:1777–92.e21. - PubMed
