. 2024 Apr;11(13):e2305631.
doi: 10.1002/advs.202305631. Epub 2024 Jan 20.

LINC MIR503HG Controls SC-β Cell Differentiation and Insulin Production by Targeting CDH1 and HES1

Affiliations

LINC MIR503HG Controls SC-β Cell Differentiation and Insulin Production by Targeting CDH1 and HES1

Yang Xu et al. Adv Sci (Weinh). 2024 Apr.

Abstract

Stem cell-derived pancreatic progenitors (SC-PPs), as an unlimited source of SC-derived β (SC-β) cells, offers a robust tool for diabetes treatment in stem cell-based transplantation, disease modeling, and drug screening. Whereas, PDX1+/NKX6.1+ PPs enhances the subsequent endocrine lineage specification and gives rise to glucose-responsive SC-β cells in vivo and in vitro. To identify the regulators that promote induction efficiency and cellular function maturation, single-cell RNA-sequencing is performed to decipher the transcriptional landscape during PPs differentiation. The comprehensive evaluation of functionality demonstrated that manipulating LINC MIR503HG using CRISPR in PP cell fate decision can improve insulin synthesis and secretion in mature SC-β cells, without effects on liver lineage specification. Importantly, transplantation of MIR503HG-/- SC-β cells in recipients significantly restored blood glucose homeostasis, accompanied by serum C-peptide release and an increase in body weight. Mechanistically, by releasing CtBP1 occupying the CDH1 and HES1 promoters, the decrease in MIR503HG expression levels provided an excellent extracellular niche and appropriate Notch signaling activation for PPs following differentiation. Furthermore, this exhibited higher crucial transcription factors and mature epithelial markers in CDH1High expressed clusters. Altogether, these findings highlighted MIR503HG as an essential and exclusive PP cell fate specification regulator with promising therapeutic potential for patients with diabetes.

Keywords: differentiation; human pluripotent stem cells; lncRNA; pancreatic progenitors; scRNA‐seq.


Conflict of interest statement

The authors declare no conflict of interest.

Figures
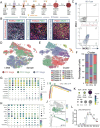
Figure 1
Figure 1
lncRNA landscape during human PP cell differentiation. A) Schematic representation of differentiation protocol imitating human pancreatic β cell development. B) IF of PG, PFG, and PP cells for corresponding markers. Scale bar: 100 µm. C) FCM performed on PP cell populations for PDX1 and NKX6.1. D) t‐SNE projection from unsupervised clustering of scRNA‐seq of PG, PFG, and PP cell transcriptional data. E) t‐SNE visualization of cells, colored by cell type. F) Calculated percentage of defined PG, PFG, and PP cell clusters. G,H) Dot plot showing DEGs in different cell clusters. Color and size of each dot represent the expression level and percentage of cells expressing the given gene. I) Distribution of pseudotime of PG, PFG, and PP cells. J) Upper panel: t‐SNE visualization of cells based on the expression of MIR503HG expression. Lower panel: Distribution of pseudotime of PG, PFG, and PP cells based on expression of PDX1 expression. K) Calculated percentage and expression levels of MIR503HG expressed PG, PFG, and PP cells. L) qRT‐PCR analysis of MIR503HG expression in cells at different stages. qRT‐PCR, FCM, and staining results were repeated in at least three independent differentiations. All data are expressed as means ± SD. Statistical significance was calculated using a two‐tailed Student's t‐test.
Figure 2
Figure 2
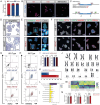
MIR503HG−/− H9 cell line establishment using CRISPR/Cas9‐based genome editing. A) MIR503HG distribution in PP cytoplasm and nucleus. B) FISH of U6, 18S, and MIR503HG in PPs. Scale bars, 50 µm. C) Representative chart of sgRNA for CRISPR/Cas9. D) ALP staining of WT and MIR503HG‐KO ES cells. Scale bar, 500 µm. E) IF for NANOG/KI67 of WT and MIR503HG‐KO ES cells colonies. Scale bars for low magnification, 500 µm; Scale bars for high magnification, 10 µm. F) IF for stem cell markers of WT and MIR503HG‐KO ES cells colonies. Scale bars, 500 µm. G) and H) FCM performed on hESC‐H9 WT and hESC‐H9 KO cell populations for OCT4/SOX2 or OCT4/NANOG, respectively. I) Population percentage of OCT4/SOX2 and OCT4/NANOG double positive cells (n = 3). Data are expressed as means ± SD. J) High‐resolution G‐banding analysis of MIR503HG‐KO ES cells at passage. K) DEGs between WT and MIR503HG‐KO ES cells from mRNA‐seq. L) Exhibition of top 10 KEGG based on DEGs in (K). M) Heatmap for DEGs between WT and MIR503HG‐KO ES cells from mRNA‐seq. N) qRT‐PCR analysis of stem cell markers expression levels. qRT‐PCR, staining, and FCM results were repeated in at least three independent differentiations. All data are expressed as means ± SD. Statistical significance was calculated using a two‐tailed Student's t‐test.
Figure 3
Figure 3
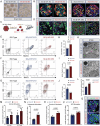
MIR503HG−/− hESCs efficiently differentiated into functional SC‐β cells in vitro. A) Brightfield images of WT and MIR503HG‐KO SC‐β cell clusters. Scale bars, 500 µm. B) IF for INS/GCG and PDX1/NKX6.1 of WT and MIR503HG‐KO SC‐β cell clusters at day 7 of Stage 6. Scale bars, 50 µm. C) Schematic of SC‐β cell clusters digested into single cells and then cultured in culture flasks. D) IF for C‐peptide/NKX6.1 and NKX6.1/MAFA of WT and MIR503HG‐KO SC‐β cell clusters at day 21 of Stage 6. Scale bars, 50 µm. E–G) FCM of WT and MIR503HG‐KO SC‐β cells for INS/NKX6.1, Chromogranin A (CHGA)/MAFA, INS/GCG. H–J) Population percentages of INS/NKX6.1, CHGA/MAFA, and INS/GCG double positive cells (n = 3). Data are expressed as means ± SD. (K) TEM images of INS granules in WT and MIR503HG‐KO SC‐β cells. Scale bars, 0.1 µm. L) Proportions of INS granule‐containing cells quantified by morphological analysis of TEM images of SC‐β cells (n = 8). Data presented as mean values ± SD. M) GSIS of WT and MIR503HG‐KO SC‐β cells. N–P) INS secretion after stimulation with tolbutamide (n = 5), exendin‐4 (n = 5), and KCl (n = 5). L) qRT‐PCR analysis of pancreatic developmental and maturation marker expressions for WT and MIR503HG‐KO SC‐β cells. Q) IF for C‐peptide/KI67 of WT and MIR503HG‐KO SC‐β cells. Scale bars, 20 µm. These results were repeated in at least three independent differentiations. All data are expressed as means ± SD. Statistical significance was calculated using a two‐tailed Student's t‐test.
Figure 4
Figure 4
MIR503HG−/− cells could rapidly reversed hyperglycemia in vivo. A) Schematic diagram for in vivo functional assays of transplanted SC‐β cells. B) IF for INS/NKX6.1‐double positive normal or STZ‐induced diabetic mouse islets. Scale bars, 50 µm. C,D) Human C‐Peptide content in the serum of mice grafted with WT and MIR503HG‐KO β cells 1 week or 5 weeks post‐transplantation. E) IF for C‐Peptide/NKX6.1 and C‐Peptide/GCG of grafts from mice transplanted with WT and MIR503HG‐KO β cells 1 week or 5 weeks post‐transplantation. Scale bars, 50 µm. F) Calculated percentages for C‐PEP+/GCG+ or C‐PEP+/GCG positive of WT and MIR503HG‐KO groups by morphological analysis of IF images of SC‐β cells (n = 8) using ImageJ. Data presented as mean values ± SD. G) IPGTT analysis of mice transplanted with different SC‐β cells and without transplantation (n = 7). H) AUC analysis of mice transplanted with different SC‐β cells (n = 7). I) Body weight gain of mice with different SC‐β cells (n = 7). J) Blood glucose of mice transplanted with different SC‐β cells and without transplantation for several weeks (n = 7). K) IF for C‐Peptide/NKX6.1 and C‐Peptide/GCG of grafts from mice transplanted with KO and WT β cells 14 weeks post‐transplantation. Scale bars, 100 µm. These results were repeated in at least three independent differentiations. All data are expressed as means ± SD. Statistical significance was calculated using a two‐tailed Student's t‐test.
Figure 5
Figure 5
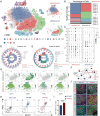
Loss of MIR503HG improved pancreatic lineage specification. A) t‐SNE projection from unsupervised clustering of transcriptional data from WT and MIR503HG‐KO PFG scRNA‐seq. B) Calculated percentage of defined WT and MIR503HG‐KO PFG clusters. C) Dot plot presenting DEGs in different cell clusters. Color and size of each dot represent expression levels and the percentage of cells expressing the given gene, respectively. D) GO and E) KEGG analysis for DEGs between WT and MIR503HG‐KO PFGs. F) Representative chart of CDH1high and CDH1low cell clusters defined by scRNA‐seq. G) t‐SNE projection of cells colored based on the expression of CDH1, CDH2, PDX1, and SOX9. H) FCM of WT and MIR503HG‐KO PPs for PDX1/NKX6.1. I) Population percentage of PDX1/NKX6.1 double positive cells (n = 3). Data are expressed as means ± SD. J) IF for FOXA2/SOX9, PDX1/NKX6.1, and E‐cad/PDX1 of WT and WT and MIR503HG‐KO PPs. Scale bars, 50 µm. FCM and staining results were repeated in at least three independent differentiations. All data are expressed as means ± SD. Statistical significance was calculated using a two‐tailed Student's t‐test.
Figure 6
Figure 6
MIR503HG physically interacted with CtBP1 in PPs. A) Silver staining of RNA pull‐down proteins for MIR503HG. Highlighted region was cut and submitted for subsequent mass spectrometry. Arrowhead indicates CtBP1 at bands between 40–50kDa. B) List of proteins detected by mass spectrometry. C) GO analysis of MIR503HG‐enriched proteins after RNA pull down. D) WB analysis for the specific interaction between MIR503HG and CtBP1. E) RIP enrichment and qRT‐PCR analyses for determining whether MIR503HG was associated with CtBP1 relative to the input control. F) Deletion mapping of CtBP1‐binding domain in MIR503HG using FL (full length)‐AS as a negative control. G,H) qRT‐PCR analysis of MIR503HG and CtBP1 expression level for PPs after MIR503HG knockdown or overexpression. I) WB analysis for CtBP1 protein after MIR503HG KD or overexpression using GAPDH as a loading control. Relative optical density analyzed by ImageJ. Results were repeated in at least three independent differentiations. All data are expressed as means ± SD. Statistical significance was calculated using a two‐tailed Student's t‐test.
Figure 7
Figure 7
MIR503HG was indispensable for CtBP1 in the transcriptional co‐repression of E‐cadherin and HES1 in PPs. A) t‐SNE projection of WT and MIR503HG‐KO PPs colored based on the expression of CtBP1, MKI67, EpCAM, and HES1. Arrowhead denotes Cluster 6. B–D) WB analysis highlighting changes in E‐cad, PDX1, NKX6.1, CtBP1, SOX9, and HES1 of different groups using GAPDH as a loading control. E,F) Chip‐qRT‐PCR analysis for CtBP1 occupation of CDH1 mRNA and HES1 mRNA promoters. G) IF for CtBP1/E‐cad and EpCAM/PDX1 of WT and MIR503HG‐KO PPs. Scale bars, 50 µm. TEM images of Zonula Adherens in WT and MIR503HG‐KO SC‐β cells. Scale bars, 0.1 µm. Arrowhead indicates zonula adherens. H) IF for HES1/PDX1 of WT and MIR503HG‐KO PPs. Scale bars, 50 µm. Calculated percentages for HES1 and PDX1 positive of WT and MIR503HG‐KO groups by morphological analysis of IF images of SC‐β cells (n = 6) using ImageJ. Data presented as mean values ± SD. I) IF for FOXA2/KI67 and PDX1/KI67 of WT and MIR503HG‐KO PGs, PFG, and PPs separately. Scale bars, 50 µm. J) Calculated percentage for KI67‐positive WT and MIR503HG‐KO PGs, PFG, and PPs by morphological analysis of IF images of SC‐β cells (n = 6) using ImageJ. Data presented as mean values ± SD. K) IF for YAP1 of WT and MIR503HG‐KO PPs. Scale bars, 50 µm. L) WB analysis for p‐YAP1, YAP1, VIMENTIN, EpCAM, and SNAI2 of WT and MIR503HG‐KO PPs using GAPDH as a loading control. M) Calculated percentage for p‐YAP/YAP1 ratio of WT and MIR503HG‐KO PPs. Relative optical density analyzed by ImageJ. Experiments were performed in triplicate. N) IF for PDX1/EDU‐double positive of WT and MIR503HG‐KO PPs. Scale bars, 50 µm. Calculated percentage for EdU positive of WT and MIR503HG‐KO PPs by morphological analysis of IF images of SC‐β cells (n = 5) using ImageJ. Data presented as mean values ± SD. O) Schematic diagram for a proposed model of MIR503HG function during PP differentiation and proliferation. Results were repeated in at least three independent differentiations. All data are expressed as means ± SD. Statistical significance was calculated using a two‐tailed Student's t‐test.

References

    1. Magliano D. J., Boyko E. J., in IDF Diabetes Atlas, Brussels: 2023.
    1. Hogrebe N. J., Ishahak M., Millman J. R., Cell Stem Cell 2023, 30, 530. - PMC - PubMed
    1. a) Hogrebe N. J., Maxwell K. G., Augsornworawat P., Millman J. R., Nat. Protoc. 2021, 16, 4109; - PMC - PubMed
    2. b) Rezania A., Bruin J. E., Arora P., Rubin A., Batushansky I., Asadi A., O'Dwyer S., Quiskamp N., Mojibian M., Albrecht T., Yang Y. H., Johnson J. D., Kieffer T. J., Nat. Biotechnol. 2014, 32, 1121; - PubMed
    3. c) Hogrebe N. J., Augsornworawat P., Maxwell K. G., Velazco‐Cruz L., Millman J. R., Nat. Biotechnol. 2020, 38, 460; - PMC - PubMed
    4. d) Pagliuca F. W., Millman J. R., Gurtler M., Segel M., Van Dervort A., Ryu J. H., Peterson Q. P., Greiner D., Melton D. A., Cell 2014, 159, 428; - PMC - PubMed
    5. e) Russ H. A., Parent A. V., Ringler J. J., Hennings T. G., Nair G. G., Shveygert M., Guo T., Puri S., Haataja L., Cirulli V., Blelloch R., Szot G. L., Arvan P., Hebrok M., EMBO J. 2015, 34, 1759; - PMC - PubMed
    6. f) Zhou Q., Melton D. A., Nature 2018, 557, 351; - PMC - PubMed
    7. g) Mahaddalkar P. U., Scheibner K., Pfluger S., Ansarullah, Sterr M., Beckenbauer J., Irmler M., Beckers J., Knobel S., Lickert H., Nat. Biotechnol. 2020, 38, 1061. - PubMed
    1. Memon B., Abdelalim E. M., Cells 2020, 9, 283 . - PMC - PubMed
    1. a) Ramzy A., Belmonte P. J., Braam M. J. S., Ida S., Wilts E. M., Levings M. K., Rezania A., Kieffer T. J., Endocr Rev 2023, 44, 222; - PubMed
    2. b) Yoshihara E., O'Connor C., Gasser E., Wei Z., Oh T. G., Tseng T. W., Wang D., Cayabyab F., Dai Y., Yu R. T., Liddle C., Atkins A. R., Downes M., Evans R. M., Nature 2020, 586, 606. - PMC - PubMed

MeSH terms

LinkOut - more resources