. 2024 Jan;204(1):241-255.
doi: 10.1007/s00442-023-05504-9. Epub 2024 Jan 20.

Avian responses to climate extremes: insights into abundance curves and species sensitivity using the UK Breeding Bird Survey

Affiliations

Avian responses to climate extremes: insights into abundance curves and species sensitivity using the UK Breeding Bird Survey

Pietro Tirozzi et al. Oecologia. 2024 Jan.

Abstract

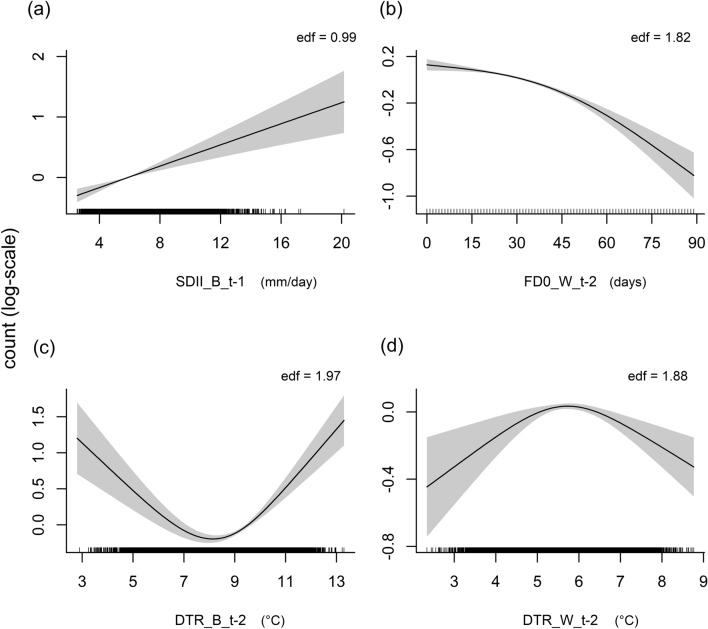
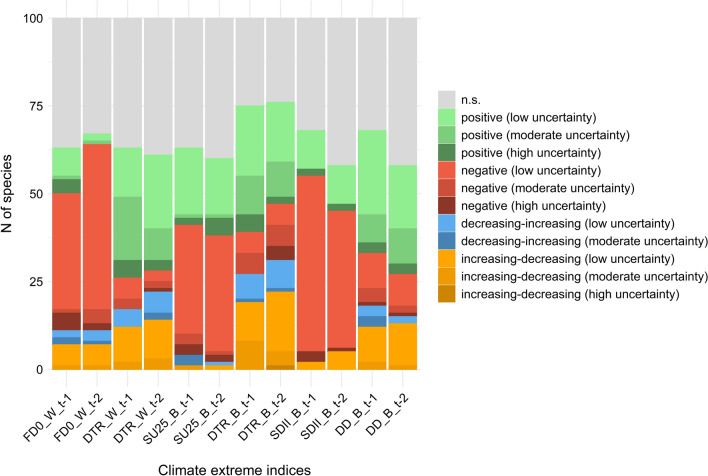
Climate change remains one of the most urgent challenges for biodiversity conservation. Recent studies have highlighted that climate extremes (CLEXs) can lead to widespread and negative effects across all taxa and ecological levels, but most of these studies are based on short-term periods and small spatial scales and lack a multi-species approach. Here, using generalised additive models (GAMs) and the UK Breeding Bird Survey (BBS), we described response curves for the abundance of 100 resident bird species over large spatial and temporal scales and identified the species showing a greater sensitivity to CLEXs. We used five climatic indices computed at 1-km spatial resolution as proxies of CLEXs during the winter or breeding season and considered both 1- and 2-year lagged effects. The results demonstrated widespread and significant effects of CLEXs on bird abundances at both time lags and in both seasons. Winter frost days (FD0), summer days (SU25) during the breeding season and simple precipitation intensity index (SDII) during the breeding season mainly showed negative effects. Daily temperature range (DTR) in both winter and breeding season and dry days (DD) during the breeding season led to diversified responses across the species, with a prevalence of positive effects. A large proportion of species showed a high sensitivity to CLEXs, highlighting that these species may deserve attention in future studies aimed at biodiversity conservation. We demonstrated that CLEXs can represent a significant driver affecting population abundances over large spatial and temporal scales, emphasising the need for understanding mechanistic processes at the basis of the observed effects.

Keywords: Birds; Climate change; Extreme events; Rainfall; Temperature.


Conflict of interest statement

The authors declare that they have no conflict of interest.

Figures

Fig. 1
Fig. 1
Spatial distribution of the UK BBS squares surveyed between 1994 and 2019 that have been used in this study. The number of years each square was surveyed during the whole period (number of years) is represented by a colour gradient from yellow to blue. The number of squares belonging to each class of frequency is reported in parentheses
Fig. 2
Fig. 2
Examples of the four types of response curves in relation to the indices of CLEXs. Partial effects plots describe the relationship between the expected count (y-axis, log-scale with the smooth function centred around zero) and the climatic indices. Edf (p-value < 0.001 in the showed cases) represents the edf estimated for the smooth function. Rugs on the x-axis represent the distribution of values of the explanatory variable. The grey area represents the 95% confidence interval for the regression line. A positive effect of the simple precipitation intensity index (SDII) is shown for the Eurasian siskin (Spinus spinus) in (a), a negative effect of frost days (FD0) for the white wagtail (Motacilla alba) in (b), a decreasing–increasing effect of the daily temperature range (DTR) for the northern raven (Corvus corax) in (c) and an increasing–decreasing effect of DTR for the Eurasian bullfinch (Pyrrhula pyrrhula) in (d). After the acronym of the climatic index, B indicates the breading season, W the winter season and t − 1 and t − 2 the year used for the association between the climatic index and bird counts
Fig. 3
Fig. 3
Bar chart showing the repartition of the types of effects for the indices of CLEXs across the 100 species under study. FD0 frost days, DTR daily temperature range, SU25 summer days, SDII simple precipitation intensity index, DD dry days, W winter season, B breading season; t − 1 and t − 2 indicate the year used for the association between the climatic indices and bird counts. See Table 1 in ‘Materials and methods’ for details on the climatic indices. N.s. (in grey) indicates that the effect was not statistically significant. Statistically significant effects are classified into four main categories (positive: green, negative: red, decreasing–increasing: blue, increasing–decreasing: orange, see ‘Materials and methods’ for the explanation), and reported with the corresponding degree of uncertainty (from low to high) (see ‘Materials and methods’ and Supplementary Information Fig. S2) (color figure online)

References

    1. Acker P, Daunt F, Wanless S, Burthe SJ, Newell MA, Harris MP, Grist H, Sturgeon J, Swann RL, Gunn C, Payo-Payo A, Reid JM. Strong survival selection on seasonal migration versus residence induced by extreme climatic events. J Anim Ecol. 2021;90:796–808. doi: 10.1111/1365-2656.13410. - DOI - PubMed
    1. Albright TP, Mutiibwa D, Gerson AR, Smith EK, Talbot WA, O’Neill JJ, McKechnie AE, Wolf BO. Mapping evaporative water loss in desert passerines reveals an expanding threat of lethal dehydration. Proc Natl Acad Sci U S A. 2017;114:2283–2288. doi: 10.1073/pnas.1613625114. - DOI - PMC - PubMed
    1. Altwegg R, Roulin A, Kestenholz M, Jenni L. Demographic effects of extreme winter weather in the barn owl. Oecologia. 2006;149:44–51. doi: 10.1007/s00442-006-0430-3. - DOI - PubMed
    1. Bailey LD, van de Pol M. Tackling extremes: challenges for ecological and evolutionary research on extreme climatic events. J Anim Ecol. 2016;85:85–96. doi: 10.1111/1365-2656.12451. - DOI - PubMed
    1. Bani L, Luppi M, Rocchia E, Dondina O, Orioli V. Winners and losers: how the elevational range of breeding birds on Alps has varied over the past four decades due to climate and habitat changes. Ecol Evol. 2019;9:1289–1305. doi: 10.1002/ece3.4838. - DOI - PMC - PubMed

LinkOut - more resources