. 2024 Jan 20;24(1):11.
doi: 10.1007/s10238-023-01283-y.

Idiopathic erythrocytosis: a germline disease?

Affiliations

Idiopathic erythrocytosis: a germline disease?

E M Elli et al. Clin Exp Med. .

Abstract

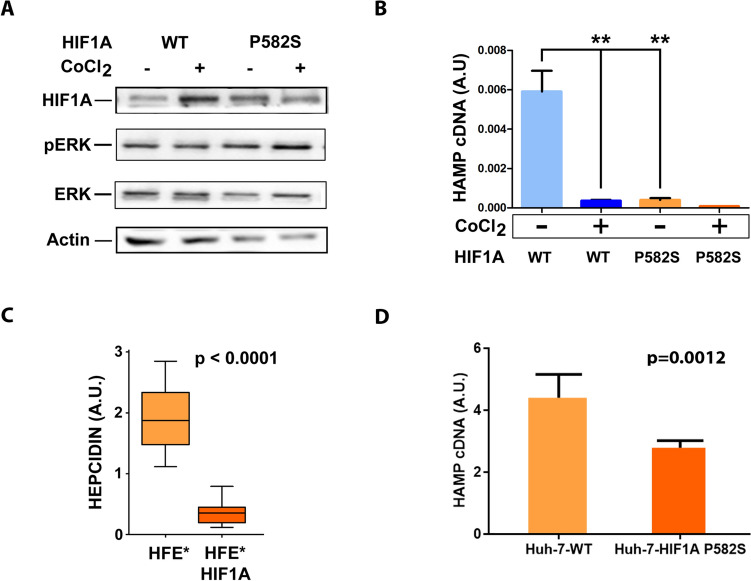
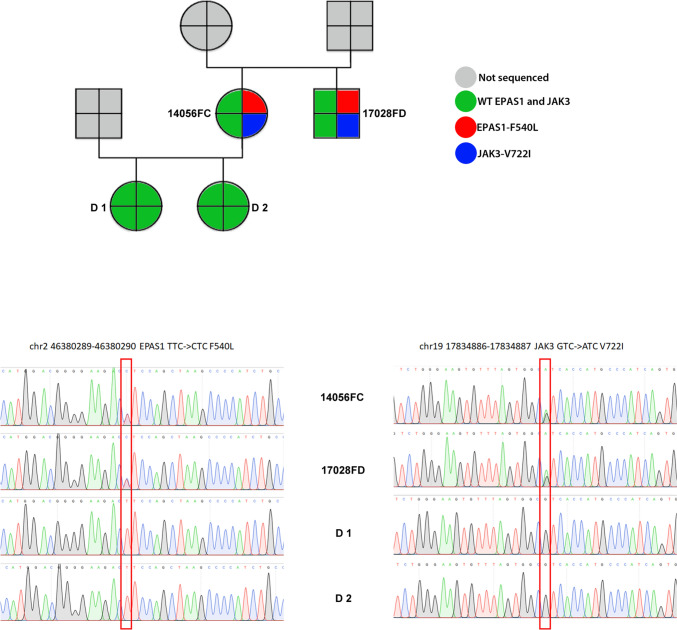
Polycythemia Vera (PV) is typically caused by V617F or exon 12 JAK2 mutations. Little is known about Polycythemia cases where no JAK2 variants can be detected, and no other causes identified. This condition is defined as idiopathic erythrocytosis (IE). We evaluated clinical-laboratory parameters of a cohort of 56 IE patients and we determined their molecular profile at diagnosis with paired blood/buccal-DNA exome-sequencing coupled with a high-depth targeted OncoPanel to identify a possible underling germline or somatic cause. We demonstrated that most of our cohort (40/56: 71.4%) showed no evidence of clonal hematopoiesis, suggesting that IE is, in large part, a germline disorder. We identified 20 low mutation burden somatic variants (Variant allelic fraction, VAF, < 10%) in only 14 (25%) patients, principally involving DNMT3A and TET2. Only 2 patients presented high mutation burden somatic variants, involving DNMT3A, TET2, ASXL1 and WT1. We identified recurrent germline variants in 42 (75%) patients occurring mainly in JAK/STAT, Hypoxia and Iron metabolism pathways, among them: JAK3-V722I and HIF1A-P582S; a high fraction of patients (48.2%) resulted also mutated in homeostatic iron regulatory gene HFE-H63D or C282Y. By generating cellular models, we showed that JAK3-V722I causes activation of the JAK-STAT5 axis and upregulation of EPAS1/HIF2A, while HIF1A-P582S causes suppression of hepcidin mRNA synthesis, suggesting a major role for these variants in the onset of IE.

Keywords: Erythropoiesis; Idiopathic erythrocytosis; Myeloid Neoplasia; NGS sequencing.


Conflict of interest statement

The authors have no competing interests as defined by Springer, or other interests that might be perceived to influence the results and/or discussion reported in this paper.

Figures

Fig. 1
Fig. 1
Simple three-step clinical algorithm for the diagnosis of erythrocytosis (from Diagnosis and management of non-clonal erythrocytosis remains challenging: a single center clinical experience; Doma et al. Annals of Hematology, 2021; modified) Abbreviations: Hb: hemoglobin; Hct: hematocrit, NGS: next-generation sequencing; ECYT: familiar erythrocytosis; HIF-2ɑ: Hypoxia-inducible factors 2-alpha; O2: oxygen; 2–3-BPG: 2.3-bisphosphoglycerate; EPO: serum erythropoietin
Fig. 2
Fig. 2
A Distribution and molecular profile of somatic variants in IE patients; B Distribution and molecular profile of germline variants in IE patients
Fig. 3
Fig. 3
OncoPrint plot reporting the germline variants associated with the JAK-STAT pathway, Response to hypoxia, and Cellular iron ion homeostasis Gene Ontologies enriched in the IE patients. Purple tiles indicate missense mutations, orange tiles duplications and grey ones absence of mutation
Fig. 4
Fig. 4
A Western blot of representative JAK3 WT and V722I lines showing activation of JAK3 axis. Actin was used as a loading control. B Volcano plot representing the differentially expressed genes in JAK3-V722I versus JAK3-WT cell models. Red circles represent genes with |Log2 fold change|> 1 and –Log10 Benjamini-Hochberg (BH)-Adjusted p value > 1; blue circles genes with –Log10 BH-Adjusted p value > 1; green circles genes with |Log2 fold change|> 1; grey circles represent genes with |Log2 fold change|≤ 1 and –Log10 BH-Adjusted p value ≤ 1. C Barplot showing all the significant hallmarks identified in GSEA analysis. Orange bars represent positive enrichment; green ones negative enrichment. D GSEA plots reporting the two top positively (top) and negatively (bottom) enriched gene-sets significantly enriched in JAK3-V722I versus JAK3-WT cell models. E Heatmap reporting the expression level of the top leading genes of four significantly enriched gene-sets in JAK3-mutated and wild-type lines
Fig. 5
Fig. 5
A Western blot on lysates of EPAS1-WT, F540L and F374Y cell-lines in presence or absence of CoCl2 as a chemical inducer of hypoxia. Actin was used as a loading control. B Q-PCR analysis of EPO expression in EPAS1-WT, F540L and F374Y cell-lines in presence or absence of CoCl2 C Q-PCR analysis of SOCS2 expression in EPAS1-WT, F540L and F374Y cell-lines in presence or absence of CoCl2. D Q-PCR analysis of Erythropoietin (EPO) expression in HEK293 cell line transiently transfected with EPAS1-WT, F540L or F374Y cell-lines in presence or absence of CoCl2 as a chemical inducer of hypoxia E Q-PCR analysis of SOCS2 expression in HEK 293 cell line transiently transfected with EPAS1-WT, F540L or F374Y cell-lines in presence or absence of CoCl2. Data were analyzed using two-tailed, unpaired t-tests. *p < 0.05; **p < 0.005; ***p < 0.001. Histograms represent the mean of three replicates; the error bars represent the Standard Error of the Mean (SEM)
Fig. 6
Fig. 6
A Western blot on lysates of HIF1A-WT and P582S cell-lines in presence or absence of CoCl2. Actin was used as a loading control. B Q-PCR analysis of HAMP expression in HIF1A-WT and P582S cell-lines in presence or absence of CoCl2. C Analysis of plasma Hepcidin expression by ELISA assay in 3 patients affected by hemochromatosis and homozygous for HFE-C282Y versus 3 homozygous for HFE-C282Y and heterozygous for HIF1A-P582S. The boxplot shows the interquartile range; the whiskers represent the minimum-to-maximum range. D Q-PCR analysis of HAMP expression in HIF1A-WT and P582S liver HUH7 cell lines (3 replicates). Data were analyzed using two-tailed, unpaired t-tests. *p < 0.05; **p < 0.005; ***p < 0.001. Histograms represent the mean of three replicates; the error bars represent the Standard Error of the Mean (SEM)
Fig. 7
Fig. 7
Genetic Pedigree of female proband and his brother, both affected by IE. Exome analysis revealed the presence of JAK3-V722I and EPAS1-F540L heterozygous mutations in both cases. No evidence of the two variants could be found in the two healthy daughters of the proband as shown in Sanger sequencing validation

References

    1. Fairbanks VF, Tefferi A. Normal ranges for packed cell volume and hemoglobin concentration in adults: relevance to “apparent polycythemia.” Eur J Haematol. 2000;65(5):285–96. 10.1034/j.1600-0609.2000.065005285.x. - PubMed
    1. Arber DA, Orazi A, Hasserjian R, et al. The 2016 revision to the World Health Organization classification of myeloid neoplasms and acute leukemia. Blood. 2016;127(20):2391–405. 10.1182/blood-2016-03-643544. - PubMed
    1. Vannucchi AM. From leeches to personalized medicine: evolving concepts in the management of polycythemia vera. Haematologica. 2017;102(1):18–29. 10.3324/haematol.2015.129155. - PMC - PubMed
    1. Bento C. Genetic basis of congenital erythrocytosis. Int J Lab Hematol. 2018;40(Suppl 1):62–7. 10.1111/ijlh.12828. - PubMed
    1. Camps C, Petousi N, Bento C, et al. Gene panel sequencing improves the diagnostic work-up of patients with idiopathic erythrocytosis and identifies new mutations. Haematologica. 2016;101(11):1306–18. 10.3324/haematol.2016.144063. - PMC - PubMed

LinkOut - more resources