. 2024 Feb 20;5(2):101381.
doi: 10.1016/j.xcrm.2023.101381. Epub 2024 Jan 19.

UCHL1 is a potential molecular indicator and therapeutic target for neuroendocrine carcinomas

Affiliations

UCHL1 is a potential molecular indicator and therapeutic target for neuroendocrine carcinomas

Shiqin Liu et al. Cell Rep Med. .

Abstract

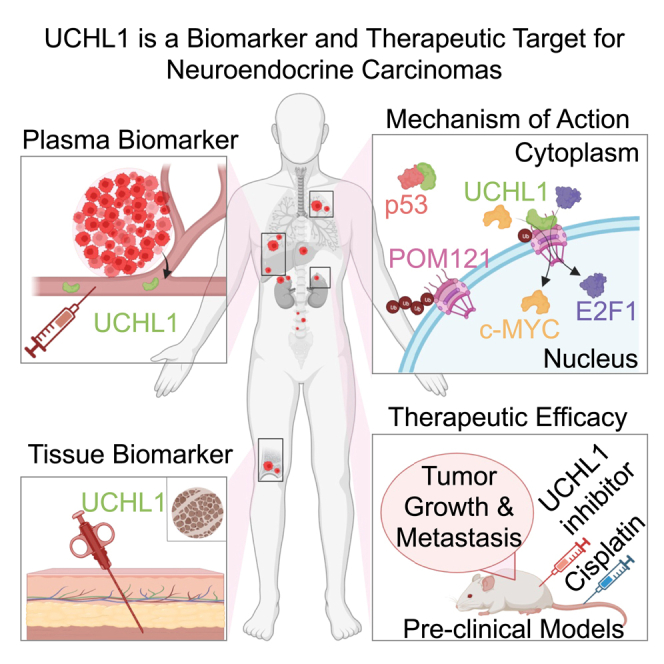
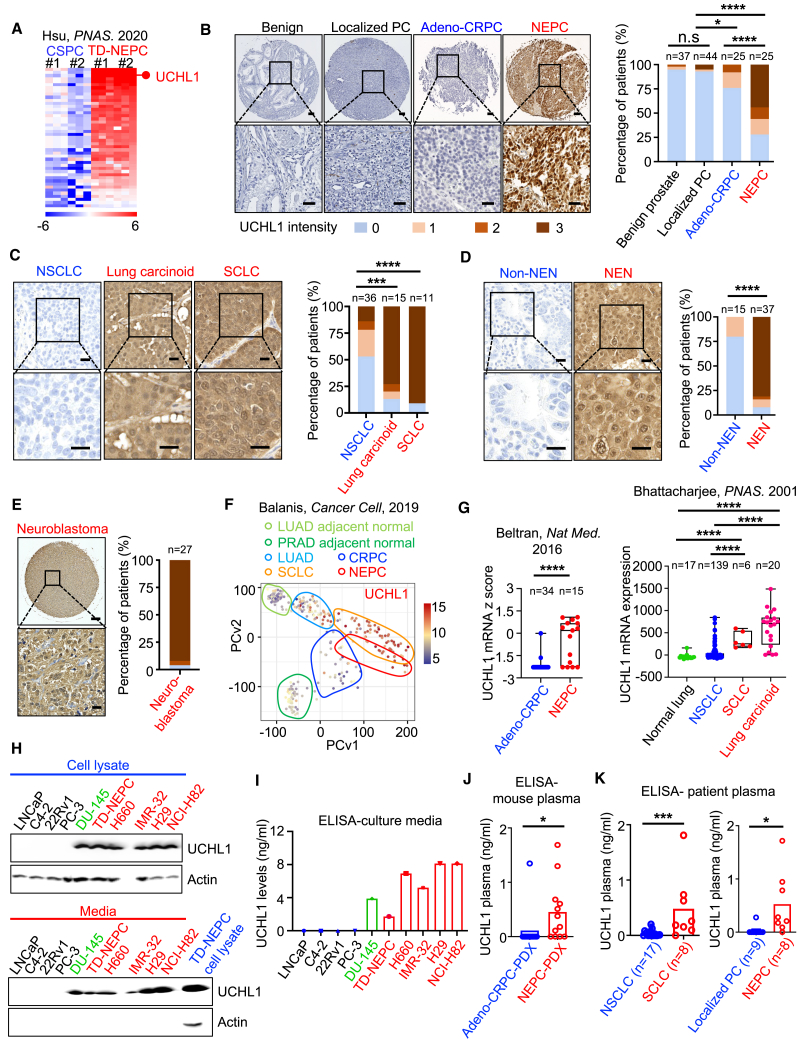
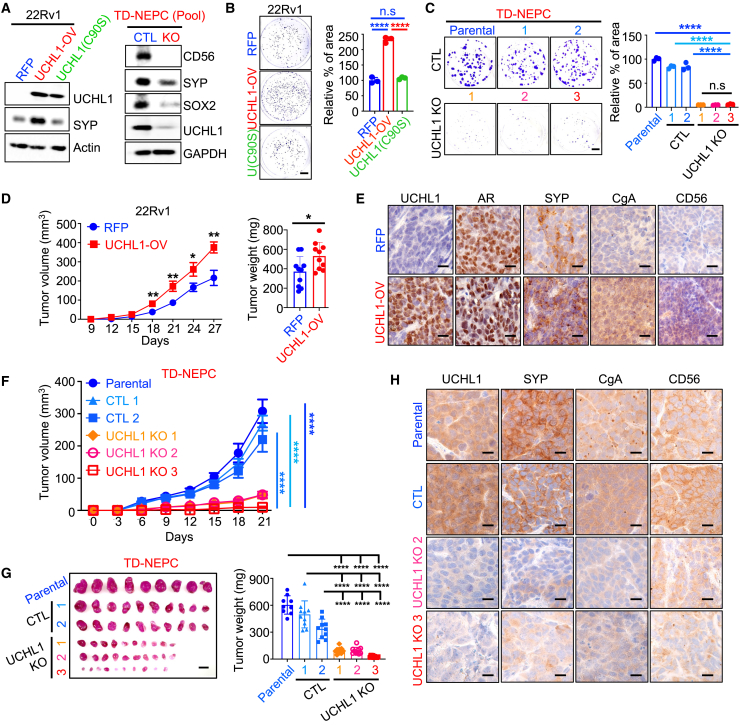
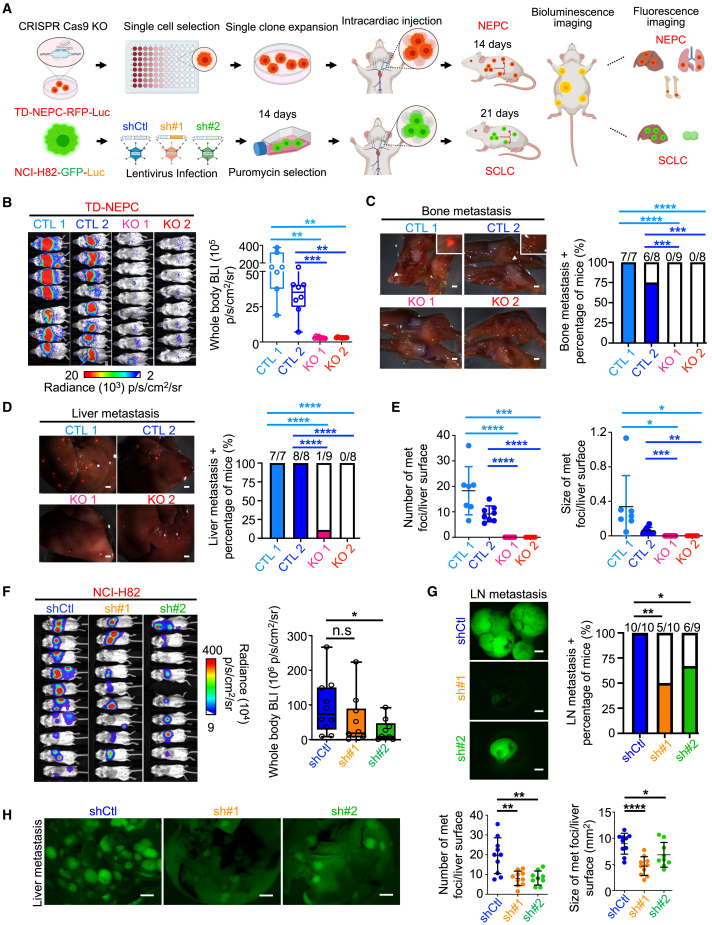
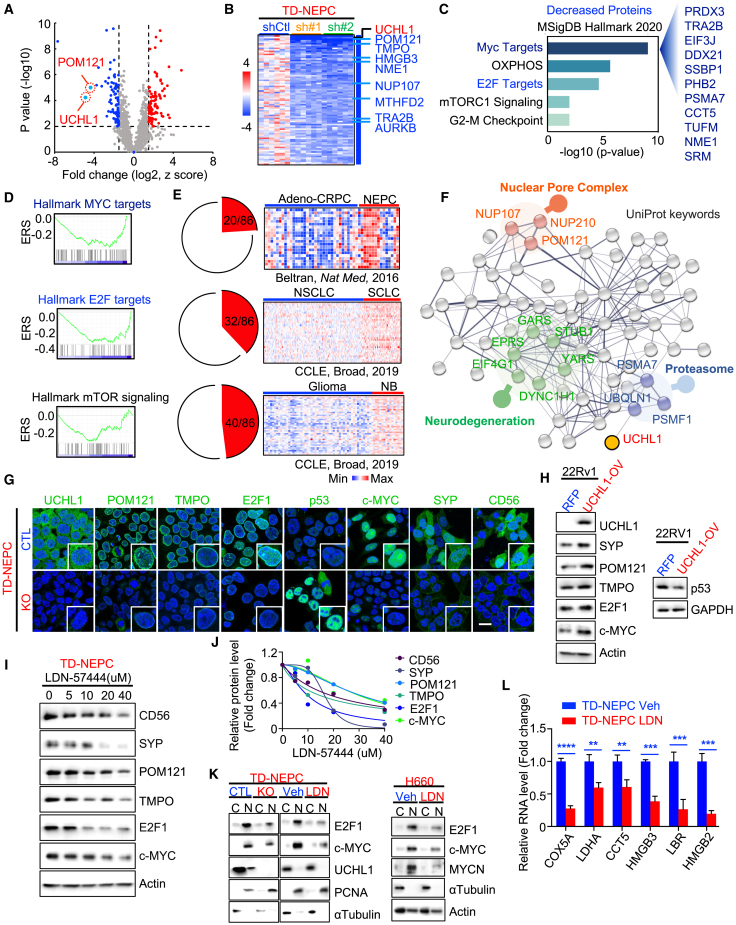
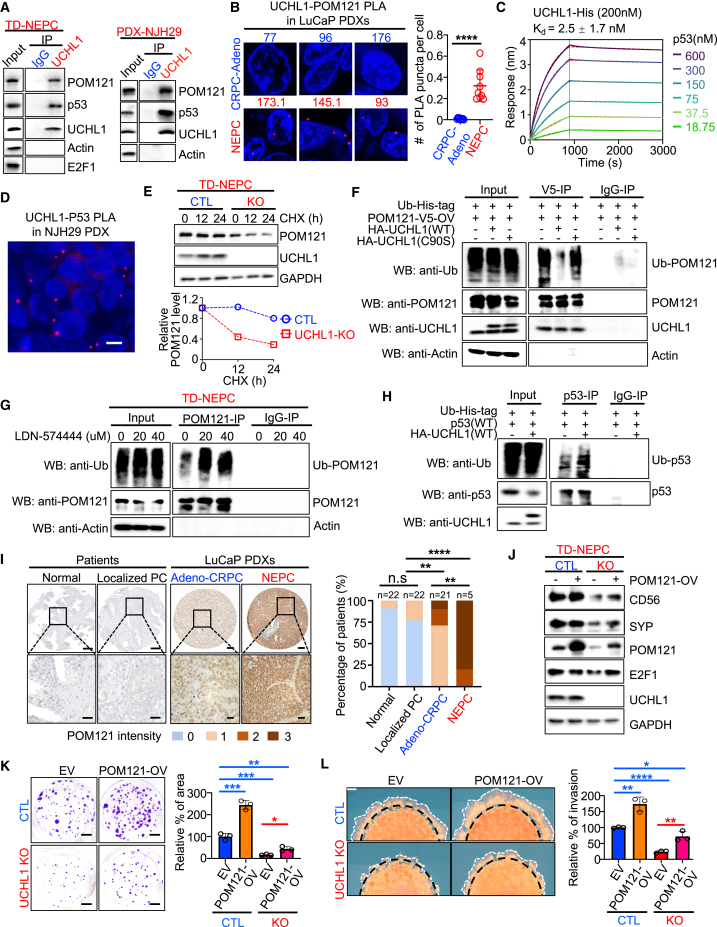
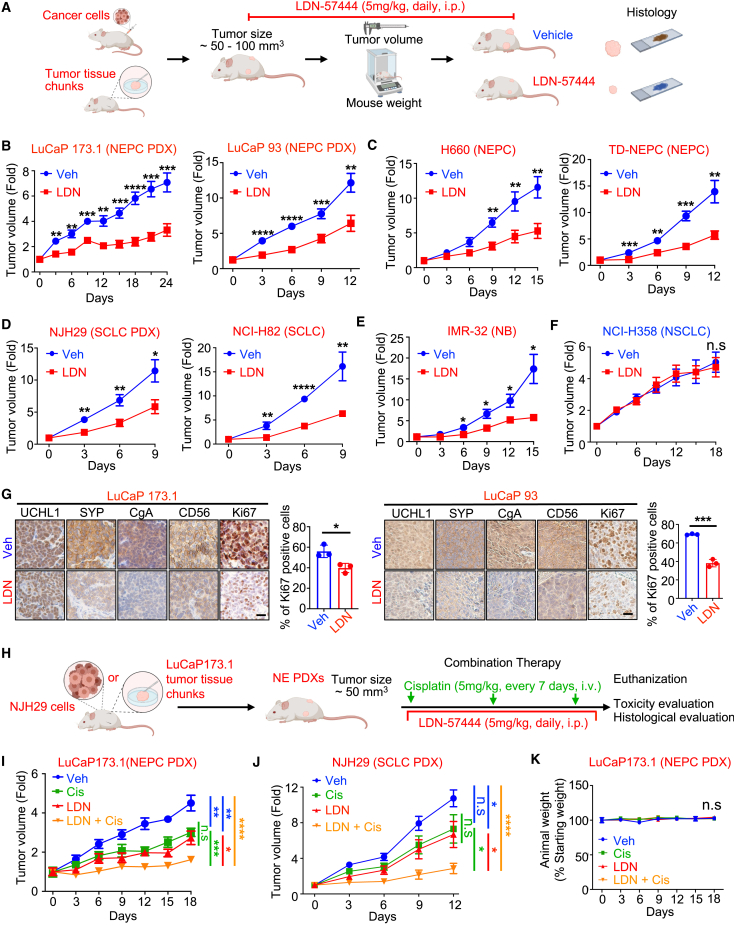
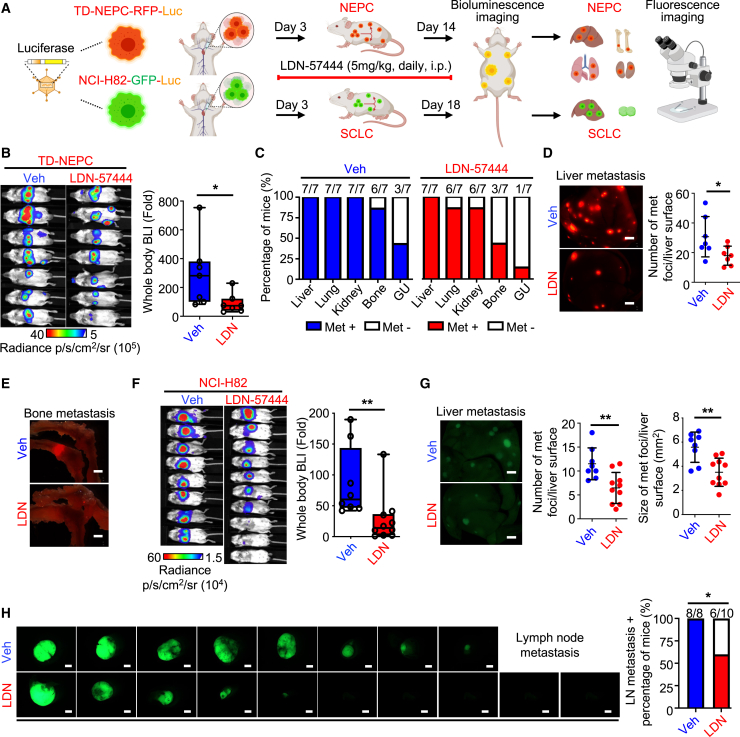
Neuroendocrine carcinomas, such as neuroendocrine prostate cancer and small-cell lung cancer, commonly have a poor prognosis and limited therapeutic options. We report that ubiquitin carboxy-terminal hydrolase L1 (UCHL1), a deubiquitinating enzyme, is elevated in tissues and plasma from patients with neuroendocrine carcinomas. Loss of UCHL1 decreases tumor growth and inhibits metastasis of these malignancies. UCHL1 maintains neuroendocrine differentiation and promotes cancer progression by regulating nucleoporin, POM121, and p53. UCHL1 binds, deubiquitinates, and stabilizes POM121 to regulate POM121-associated nuclear transport of E2F1 and c-MYC. Treatment with the UCHL1 inhibitor LDN-57444 slows tumor growth and metastasis across neuroendocrine carcinomas. The combination of UCHL1 inhibitors with cisplatin, the standard of care used for neuroendocrine carcinomas, significantly delays tumor growth in pre-clinical settings. Our study reveals mechanisms of UCHL1 function in regulating the progression of neuroendocrine carcinomas and identifies UCHL1 as a therapeutic target and potential molecular indicator for diagnosing and monitoring treatment responses in these malignancies.

Keywords: UCHL1; neuroblastoma; neuroendocrine carcinomas; neuroendocrine prostate cancer; nuclear pore complex; small cell lung cancer.


Conflict of interest statement

Declaration of interests E.C. is a consultant for Dotquant and received research funding under institutional SRAs from AbbVie, Astra Zeneca, Janssen Research, Gilead, Zenith Epigenetics, Forma Therapeutics, Bayer, Kronos, Foghorn, and MacroGenics. M.D. is a consultant for Regeneron, Beigene, Astra Zeneca, Sanofi/Genzyme, Eurofins, Janssen, and Genentech (uncompensated) and performs research at Merck, Genentech, CellSight, Novartis, AbbVie, United Therapeutics, Varian, Verily, and Celgene. J.H. is a consultant for or owns shares in Kingmed, MoreHealth, OptraScan, Genetron, Omnitura, Vetonco, York Biotechnology, Genecode, VIVA Biotech, and Sisu Pharma and received grants from Zenith Epigenetics, BioXcel Therapeutics, Inc., and Fortis Therapeutics. T.S. is a consultant for Dren Bio.

Figures

None
Graphical abstract
Figure 1
Figure 1
UCHL1 is highly expressed in neuroendocrine neoplasms (A) A heatmap represents fold change of increased proteins in TD-NEPC (Trop2-driven neuroendocrine prostate cancer) tumor xenografts compared with CSPC (LNCaP-RFP) control tumors from a published proteomic analysis. (B‒E) Representative images and quantification of IHC staining for UCHL1 in patient prostate tissues (B), lung cancers (C), other neuroendocrine neoplasms (NENs) (D), and neuroblastoma (E). Prostate tissues (B) include benign prostate tissues (n = 37), localized prostate cancer (PC) (n = 44), adenocarcinoma castration-resistant prostate cancer (adeno-CRPC; n = 25), and NEPC (n = 25). Scale bars, 100 μm (top) and 40 μm (bottom). Lung tissues (C) include non-small cell lung cancer (NSCLC; n = 36), lung carcinoid tumors (n = 15), and small cell lung cancer (SCLC; n = 11). Scale bars, 20 μm (top) and 10 μm (bottom). Other NENs (n = 37) include gastrointestinal neuroendocrine carcinomas (GI NECs; n = 3), well-differentiated GI neuroendocrine tumors (GI NETs; n = 14), well-differentiated pancreatic NETs (n = 17), poorly differentiated pancreatic NECs (n = 3), and non-NEN GI carcinomas (n = 15) (D). Scale bars, 20 μm (top) and 10 μm (bottom). (E) includes neuroblastoma (n = 27) in a tissue microarray (TMA) format. Scale bar, 200 μm (top) and 25 μm (bottom). UCHL1 staining intensity is scored from 0 to 3 (0 is negative and marked as blue, 1 is low and marked as beige, 2 is medium and marked as light brown, 3 is strongly positive and marked as dark brown). Z score distribution analysis was performed for comparison of two groups (two tailed). (F) Principal-component analysis of UCHL1 based on RNA sequencing data from normal tissues adjacent to lung adenocarcinoma (LUAD) or normal tissues adjacent to prostate adenocarcinoma (PRAD) and from LUAD, CRPC, SCLC, and NEPC patient biopsy tissues from Balanis et al. (G) UCHL1 mRNA Z score in human prostate tissues (NEPC vs. adeno-CRPC from Beltran et al. and lung tissues from Bhattacharjee et al.51). (H) Western blot showing UCHL1 protein levels in cancer cell lysates and cell culture media. Red indicates NEC cell lines. DU145 is an AR-negative and NE-like prostate cancer cell line and is indicated in green. (I) Protein levels of UCHL1 in media from the indicated cancer cell lines determined by ELISA. (J) UCHL1 levels in plasma from mice bearing prostate cancer PDXs. Assessment of plasma UCHL1 level was performed on mice bearing adeno-CRPC (LuCaP 23.1, LuCaP 35, LuCaP 86.2, and LuCaP 96) or NEPC (LuCaP 49, LuCaP 93, LuCaP 145.1, and LuCaP 173.1) PDXs. For each PDX, plasma from three individual mice was tested by ELISA (adeno-CRPC [n = 12] vs. NEPC [n = 12]). (K) UCHL1 levels in plasma of patients with SCLC (n = 8) vs. NSCLC (n = 17) and localized PC (n = 9) vs. NEPC (n = 8), determined by ELISA. UCHL1 plasma levels were compared by Student’s t test (two tailed). ∗p < 0.05, ∗∗p < 0.01, ∗∗∗p < 0.005, ∗∗∗∗p < 0.001; n.s., not significant.
Figure 2
Figure 2
UCHL1 regulates cancer cell growth in vitro and in vivo (A) UCHL1 and SYP levels in 22Rv1-RFP, 22Rv1-UCHL1-OV (WT UCHL1), and 22Rv1-UCHL1(C90S) cells were determined by western blot (WB) (left). SOX2, CD56, SYP, and UCHL1 levels in UCHL1 knockout pool cells were assessed by WB (right). (B and C) Colony formation assays of 22Rv1 with or without WT UCHL1 or UCHL1(C90S) overexpression (B) and colony formation assays of TD-NEPC parental (no transfection) cells, CTL (transfection with control non-targeting sgRNA), and UCHL1 knockout (transfection with multi-sgRNA targeting UCHL1) single-cell selection clones (C). Scale bar, 1 cm. The percentage of colony area per well was quantified using ImageJ. All experiments were performed in triplicate. Error bars, SD. (D) Subcutaneous tumor growth (left) and tumor weight (right) of 22Rv1-RFP (n = 10) and 22Rv1-UCHL1-OV (n = 10). Error bars represent standard error of the mean (SEM). (E) IHC staining of UCHL1, androgen receptor (AR) and SYP, CgA, and CD56 in 22Rv1 xenografts. Scale bar, 10 μm. (F) Subcutaneous tumor growth of TD-NEPC parental (no transduction), CTL 1 and 2, and UCHL1 knockout 1, 2, and 3 single-cell selection clone xenografts. Error bars represent SEM. (G) Harvested tumors (left) and tumor weights (right) at the endpoint (scale bar, 1 cm). (H) IHC staining for UCHL1, SYP, CgA, and CD56 in TD-NEPC parental, CTL, and UCHL1 knockout (KO) xenografts. Scale bars, 10 μm. ∗p < 0.05, ∗∗p < 0.01, ∗∗∗p < 0.005, ∗∗∗∗p < 0.001, determined by Student’s t test.
Figure 3
Figure 3
UCHL1 regulates NEPC and SCLC metastasis in vivo (A) Cartoon depicting the experimental design, generated using BioRender (https://biorender.com). (B) Whole-body BLI of the intracardiac injection metastasis model generated with TD-NEPC-CTL 1 (n = 7), TD-NEPC-CTL 2 (n = 8), TD-NEPC-UCHL1 KO 1 (n = 9), and TD-NEPC-UCHL1 KO 2 (n = 8) cells on day 14 after injection. The bioluminescence signal was quantified (right). (C) Representative fluorescence images of metastatic nodules in bone (scale bar, 1 mm). Shown are the percentage and number of animals with bone metastasis over the total number of animals (right). The Z score test for two population proportions was performed for the comparison of two groups. (D) Representative fluorescence images of metastatic nodules in excised liver (scale bar, 1 mm). The percentage of liver metastasis-positive animals over total animal number was quantified (right). (E) The number and size of metastases in liver from (D) were quantified. Error bars depict SD. (F) BLI of mice injected with SCLC shCtl, shUCHL1#1, and shUCHL1#2 cells via intracardiac injection. Whole-body bioluminescence intensity was quantified and is shown for day 21 on the right. (G) Representative GFP fluorescence images of lymph nodes (LN) (left). The percentage of mice with LN metastases was quantified (right). Scale bars, 2 mm. (H) Representative GFP fluorescence images of liver excised from animals in (F) (scale bar, 2 mm). Shown are the number and size of liver metastases based on GFP focus count (right). ∗p < 0.05, ∗∗p < 0.01, ∗∗∗p < 0.005, ∗∗∗∗p < 0.001, determined by Student’s t test.
Figure 4
Figure 4
UCHL1 modulates pathways associated with neuroendocrine differentiation (A) Volcano plot of the global protein changes in TD-NEPC UCHL1 knockdown tumor xenografts compared with TD-NEPC control tumor xenografts. UCHL1 and POM121 are indicated. p < 0.01 and fold change (log2) less than −1.5 or greater than 1.5 were chosen as cutoffs. Blue dots indicate proteins with decreased levels, and red dots indicate proteins with increased levels after UCHL1 knockdown. (B) Heatmap displaying fold change of the 86 proteins with decreased levels in UCHL1 knockdown xenografts compared with control xenografts. UCHL1, POM121, and E2F targets are indicated. (C) Significantly enriched pathways of 86 proteins with decreased levels upon UCHL1 knockdown from proteomics analysis (MSigDB Hallmark 2020). The x axis represents the −log10 (p value). (D) GSEA of the decreased proteins upon UCHL1 knockdown from the proteomics analysis. (E) Pan-NEC analysis of the 86 downregulated targets upon UCHL1 knockdown in the Beltran et al. and CCLE datasets., (F) String UniProt keywords pathway analysis of proteins with decreased levels from (B). Top enriched pathways were indicated. (G) The indicated protein levels in UCHL1 KO cells measured by immunofluorescence imaging. Scale bar, 20 μm. (H) The indicated protein levels in 22Rv1-WT UCHL1-overexpressing cells were assessed by WB. (I) The indicated protein levels in LDN-57444 (LDN)-treated TD-NEPC cells were assessed by WB. Cells were treated with LDN (0, 5, 10, 20, and 40 μM) for 72 h. (J) The quantification of the WB from (I). (K) WB of E2F1 and c-MYC levels in the cytoplasm and nucleoplasm of TD-NEPC control and UCHL1 KO cells or TD-NEPC cells treated with vehicle or LDN (left) and WB of E2F1 and c-MYC levels in the cytoplasm and nucleoplasm of H660 cells treated with vehicle or LDN (right). (L) mRNA levels of the topmost decreased MYC and E2F targets indicated in the proteomics analysis. TD-NEPC cells and H660 cells were treated with LDN(10 μM) or vehicle (Veh) for 72 h before harvesting. ∗∗p < 0.01, ∗∗∗p < 0.005, and ∗∗∗∗p < 0.001, determined by Student’s t test. Error bars depict SD.
Figure 5
Figure 5
UCHL1 binds p53 and POM121 to regulate their stabilities (A) Endogenous protein interactions were examined in TD-NEPC cells and NJH29 cells by immunoprecipitation (IP) with anti-rabbit immunoglobulin G (IgG) or anti-UCHL1 antibody and analyzed by WB with antibodies to detect UCHL1, POM121, p53, E2F1, and actin. (B) POM121 and UCHL1 interaction was examined on CRPC (n = 3) and NEPC (n = 3) LuCaP PDX tissues by PLA in situ assay. Positive signal was quantified from 3 images of each PDX model. Data are presented with SD. (C) The binding affinity of p53 with UCHL1 was assessed by biolayer interferometry assay. His-tagged UCHL1 (200 nM) was loaded on Octet NTA biosensors and incubated with serially diluted p53. The sensorgram was fitted using a 1:1 binding model (dashed line in red), and the KD value was calculated based on rates of association and dissociation yielded by the fitted curve. (D) PLA of p53 with UCHL1 in NJH29 xenografts. Scale bar, 5 μm. (E) The half-life of POM121 was determined in UCHL1 KO cells by cycloheximide (CHX; 10 μM) assay. The level of POM121 was normalized based on GAPDH level (right). (F) Ubiquitination of POM121 upon UCHL1 modulation. HEK293T cells were transfected with the indicated constructs for 48 h and treated with MG132 (10 μM) for 5 h before harvesting. POM121 was immunoprecipitated with anti-V5-antibody and immunoblotted with anti-ubiquitin (Ub) antibody. (G) Ubiquitination of POM121 upon LDN treatment. TD-NEPC cells were treated with LDN (0, 20, and 40 μM). Endogenous POM121 was immunoprecipitated with anti-POM121 antibody and immunoblotted with anti-Ub antibody. (H) Ubiquitination of p53 upon overexpression of WT UCHL1(WT). HEK293T cells were transfected with the indicated constructs for 48 h and treated with MG132 (10 μM) for 5 h before harvesting. p53 was immunoprecipitated with anti-p53 antibody and immunoblotted with anti-Ub antibody. (I) IHC staining of POM121 in a TMA containing normal (n = 22) vs. localized PC (n = 22) and the LuCaP PDX TMA including CRPC (n = 21) and NEPC (n = 5). Scale bars, 20 μm. POM121 was scored from 0 to 3. Percentages of 0, 1, 2, and 3 scores in each group were calculated (right). Z score distribution analysis was performed for comparison of two groups (two tailed). (J) WB of the indicated protein levels in TD-NEPC CTL and TD-NEPC UCHL1 KO cells with or without POM121 overexpression. (K) Colony formation assay of TD-NEPC CTL and TD-NEPC UCHL1 KO cells with or without POM121 overexpression. The percentage of colony area per well was quantified using ImageJ and normalized to the TD-NEPC CTL-EV clone. (L) 3D Matrigel drop assay of TD-NEPC CTL and TD-NEPC UCHL1 KO cells with or without POM121 overexpression. The percentage of invaded area of each drop was normalized to the TD-NEPC CTL-EV clone. Scale bars, 500 μm. The invasive area was quantified. For (K) and (L), all experiments were performed in triplicate. Error bars represent SD. For all, ∗p < 0.05, ∗∗p < 0.01, ∗∗∗p < 0.005, ∗∗∗∗p < 0.001, determined by Student’s t test.
Figure 6
Figure 6
UCHL1 inhibitor delays NEC and neuroblastoma growth in vivo (A) Schematic of the experimental design. (B) Growth curves of subcutaneous NEPC PDXs (LuCaP 173.1 and LuCaP 93) treated with Veh or LDN (5 mg/kg, daily), injected intraperitoneally (i.p.) (n = 6–7 per experimental group). (C) Growth curves of two NEPC (H660 and TD-NEPC) xenografts treated with Veh or LDN (n = 7–10 per experimental group). (D) Growth curves of two SCLC (PDX-NJH29 [n = 7–9 per experimental group] and NCI-H82 [n = 7 per experimental group]) xenografts treated with Veh or LDN. (E) Growth curves of neuroblastoma xenograft (IMR-32) treated with Veh (n = 7) or LDN (n = 6). (F) Growth curves of NSCLC (UCHL1 negative, H358) treated with Veh (n = 10) or LDN (n = 10). For all, error bars depict SEM. Tumors were harvested when the average tumor volume of the Veh group reached ∼400 mm3. (G) IHC staining for the indicated protein levels in LuCaP 173.1 and LuCaP 93 PDXs treated with Veh or LDN. Ki67 quantification of Veh- or LDN-treated LuCaP 173.1 and LuCap 93 xenografts was graphed. Scale bars, 20 μm. Data are represented as mean ± SD. (H) Schematic of the experimental design of the combination therapy (BioRender). (I) Growth curve of LuCaP 173.1 PDX treated with Veh, LDN (5 mg/kg, daily, i.p.), cisplatin (Cis; 5 mg/kg, every 7 days, intravenously [i.v.]), and LDN with Cis. (J) Growth curve of NJH29 PDX treated with Veh, LDN, Cis, and LDN with Cis. For all, ∗p < 0.05, ∗∗p < 0.01, ∗∗∗p < 0.005, ∗∗∗∗p < 0.001, determined by Student’s t test (two tailed) at the endpoint. (K) Mouse body weight from the experiment in (I).
Figure 7
Figure 7
Inhibition of UCHL1 decreases NEPC and SCLC metastasis in vivo (A) Schematic of the intracardiac injection metastasis model for treatment with LDN. The image was generated using BioRender (https://biorender.com). (B) BLI imaging of the TD-NEPC intracardiac injection metastasis model treated with Veh or LDN on day 14 post-treatment (n = 7). The bioluminescence signal was quantified by fold change compared with day 0 (right). (C) Percentage and number of metastasis-positive animals/total animal number by organ site. (D) Representative RFP fluorescence imagines of liver (scale bar, 2 mm). The number of liver metastases was quantified by counting the RFP foci (left). (E) Representative RFP fluorescence images of bone (scale bar, 2 mm). (F) BLI of the Veh- or LDN-treated intracardiac injection model generated with NCI-H82 cells. Bioluminescence intensity was quantified by fold change compared with day 0. (G) GFP fluorescence images of liver (left). Scale bar, 2 mm. The number and size of the liver metastases were quantified by GFP signals (right). (H) GFP fluorescence images of LNs with percentage of the mice with LN metastases. Scale bar, 2 mm. ∗p < 0.05, ∗∗p < 0.01, assessed by Student’s t test.

Similar articles

Cited by

References

    1. Rindi G., Mete O., Uccella S., Basturk O., La Rosa S., Brosens L.A.A., Ezzat S., de Herder W.W., Klimstra D.S., Papotti M., Asa S.L. Overview of the 2022 WHO Classification of Neuroendocrine Neoplasms. Endocr. Pathol. 2022;33:115–154. - PubMed
    1. Maris J.M. Recent advances in neuroblastoma. N. Engl. J. Med. 2010;362:2202–2211. - PMC - PubMed
    1. van Meerbeeck J.P., Fennell D.A., De Ruysscher D.K.M. Small-cell lung cancer. Lancet. 2011;378:1741–1755. - PubMed
    1. Nadal R., Schweizer M., Kryvenko O.N., Epstein J.I., Eisenberger M.A. Small cell carcinoma of the prostate. Nat. Rev. Urol. 2014;11:213–219. - PMC - PubMed
    1. Park J.W., Lee J.K., Sheu K.M., Wang L., Balanis N.G., Nguyen K., Smith B.A., Cheng C., Tsai B.L., Cheng D., et al. Reprogramming normal human epithelial tissues to a common, lethal neuroendocrine cancer lineage. Science. 2018;362:91–95. - PMC - PubMed

Publication types

MeSH terms