. 2024 Feb 1;187(3):782-796.e23.
doi: 10.1016/j.cell.2023.12.027. Epub 2024 Jan 19.

Time resolution in cryo-EM using a PDMS-based microfluidic chip assembly and its application to the study of HflX-mediated ribosome recycling

Affiliations

Time resolution in cryo-EM using a PDMS-based microfluidic chip assembly and its application to the study of HflX-mediated ribosome recycling

Sayan Bhattacharjee et al. Cell. .

Abstract

The rapid kinetics of biological processes and associated short-lived conformational changes pose a significant challenge in attempts to structurally visualize biomolecules during a reaction in real time. Conventionally, on-pathway intermediates have been trapped using chemical modifications or reduced temperature, giving limited insights. Here, we introduce a time-resolved cryo-EM method using a reusable PDMS-based microfluidic chip assembly with high reactant mixing efficiency. Coating of PDMS walls with SiO2 virtually eliminates non-specific sample adsorption and ensures maintenance of the stoichiometry of the reaction, rendering it highly reproducible. In an operating range from 10 to 1,000 ms, the device allows us to follow in vitro reactions of biological molecules at resolution levels in the range of 3 Å. By employing this method, we show the mechanism of progressive HflX-mediated splitting of the 70S E. coli ribosome in the presence of the GTP via capture of three high-resolution reaction intermediates within 140 ms.

Keywords: HflX; microfluidics; recycling; ribosome; short-lived intermediates; single-particle cryo-EM; time-resolved cryo-EM; translation.


Conflict of interest statement

Declaration of interests Columbia University has filed patent applications related to this work for which X.F. and J.F. are inventors.

Figures

Figure 1.
Figure 1.. The modular PDMS-based microfluidic chip assembly for TRCEM sample preparation.
(A) Schematic showing the setup for TRCEM using the mixing-spraying-plunging method. (B) The microfluidic chip assembly, comprising three parts: micromixer, microreactor and microsprayer. (C) The splitting-and-recombination (SAR) based micromixer, fabricated by soft-lithography. (D) Fluorescence distribution along the micromixer with five mixing units under different inlet flow rate conditions, ranging from 2 to 6 μL/s. The mixing efficiency is characterized by the evenness in the distribution of fluorescent fluid. (E) Mixing efficiency for the micromixer at the exit under different flowrate conditions, ranging from 2 to 6 μL/s. The high mixing performance of this micromixer was validated both numerically and experimentally. (F) Microsprayer, with inner and outer tubing aligned and centered, used for depositing the reaction product onto the grid. The micro-spray (illuminated by red laser) is generated under the conditions of liquid flow rate 6 μL/s and gas pressure 8 psi, (G) The set of microfluidic chips employed to achieve required reaction time points of 10, 25, 140, and 900 ms for the HflX study. (H) Compared with the PDMS surface without any coating layer, and with DDM coating, the SiO2 coating shows effective mitigation of protein adsorption (E. coli 70S is used as a sample). (I) The SiO2 coating functions well even after one month (here both E. coli 70S and HflX are used as samples).
Figure 2.
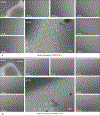
Figure 2.. Data collection strategies on droplet-based cryo-grid prepared by mixing-spraying TRCEM method.
(A) Collect as many micrographs as possible on each droplet. The number of particles gradually decreases when the target moves away from the grid bar, in the direction of areas marked in blue, cyan, yellow and red. (B) Collect only along two or three lines of holes which are near and parallel to the grid bar.
Figure 3.
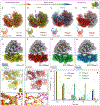
Figure 3.. Molecular details of subunit interface during the progressive opening of the 70S ribosome
(A) Superimposition of reconstructions to show the opening of the 30S subunit from apo-70S (yellow) to i70SHflX-I (red) to accommodate HflX. The green line represents the initial axis of 30S rotation, Axis I. (B) and (C), Reconstructions of second and third intermediates overlapped with first intermediate, showing the stepwise splitting of the 70S by HflX by rotation of the 30S subunit around Axis II (green line). The corresponding rotation angles and direction of 30S rotation are shown in cartoon book representations. (D), Reconstruction of the 50S-HflX complex after the departure of the 30S subunit, overlapped with the first 70S intermediate. In (A) through (D), all reconstructions are aligned on the 50S subunit. (E) to (H) are the high-resolution densities of control 70S at 900 ms and three intermediates obtained within 140 ms, showing the stepwise rotation of 30S subunit during recycling with respect to the 50S subunit (gray). (I) and (J) are the zoomed views of Coulomb densities in yellow for apo-70S and red for i70SHflX-I, respectively, and corresponding atomic models (gray) showing the rearrangement of the protein uL2 of the 50S subunit and bS6 of the 30S subunit to accommodate HflX. (K) and (L), Coulomb densities, and corresponding ribbon models of helix H69 from apo-70S (yellow), and i70SHflX-I (red), respectively, showing the very first movement of H69. HflX is shown in magenta. (M) Kinetics of the splitting reaction in terms of the number of particles per class as a function of time, obtained by 3D classification. The connecting lines between the data points are added for clarity to show the increases and decreases of subpopulation counts.
Figure 4.
Figure 4.. Shift of uS12 toward HflX and involvement of HflX in splitting of 70S ribosome.
(A)and (B) Zoomed view of HflX and uS12 interactions with the 30S subunit in i70SHflX-I and i70SHflX-III states, respectively. Due to the stepwise separation of the 30S from the 50S subunit during splitting, there occurs a steric clash (red star) at 140 ms due to the subsequent shift of the whole uS12, which is not present at earlier states like10 ms, and this clash is the cause for the final separation of the 30S from the 50S subunit. (C) The same clash at 140 ms from i70SHflX-III is shown in the density map with a fitted model. (D) Pulling of H71 by the NTD of HflX, causing the disruption of intersubunit bridge B3 between H71 and h44. (E) Zoomed view showing the interacting residues of H71 and HflX. (F) shift of HflX during pulling of H71. (G) The same interaction is shown in the density map with a fitted model.
Figure 5.
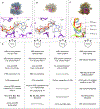
Figure 5.. Fitting of GTP, spring-like nature of H34, and molecular events associated with HflX-mediated ribosome splitting.
(A) Refined density map of i70SHflX-III (in mesh) with an atomic model fitted in with the zoomed view of i70SHflX-III with the fitted model of GTP. (B) Refined density map of 50SHflX (in mesh) with atomic model fitted in, along with the zoomed view of 50SHflX with the fitted model of GTP. (C) Superimposition of atomic models of apo-70S and three intermediates with the zoomed view of H34 showing its spring-like behavior. Corresponding colors are indicated. (D) Tabulation of molecular events during the 70S splitting by HflX.
Figure 6.
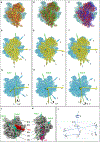
Figure 6.. Axes of rotation of 30S subunit during splitting/recycling of the 70S ribosome:
(A), (B), and (C), rotation of 30S subunit from Apo-70S (yellow) to i70SHflX-I (red), i70SHflX-I (red) to i70SHflX-II (green), and i70SHflX-I (red) to i70SHflX-III (blue), respectively. (D), (E), and (F), characterization of the 30S subunit rotation, with the 50S subunit (cyan) fixed in space. The models show the rotated state of the 30S subunit in each case. For clarity, 30S subunits are represented with only their principal axes of inertia. Rotation axes (Axis I, Axis II) are shown as green arrows indicating the direction (right-hand thumb rule) of the rotation (black curled arrows). (D) Rotation by 5.9° of 30S subunit around Axis I from Apo-70S (yellow) to i70SHflX-I (red). (E) and (F), Rotations by 7.9° and 16.1°, respectively, of 30S subunit around Axis II. (G), (H), and (I), same representation as (D), (E), and (F) omitting the 30S subunit to show the axes clearly. (J) and (K), Intersubunit bridges through which Axes I and II pass in the 50S and 30S subunit, respectively. (L) Formulation of rigid body motion, along with location of the rotation axis. Initial and transformed positions are respectively denoted by A (position vector x0) and B (position vector x1). The shift from A to B is given by translation vector t. Points with dotted circles are on the plane perpendicular to the rotation axis lˆ. Points Ap and Bp are projections of points A and B, respectively. t and t are respectively the parallel and perpendicular components of the translation vector t. Axis lˆ and angle θ describes the rotation of the rigid body from point A to B. The rotation axis lˆ passes through the point given by the position vector C. The solution for the position vector C is obtained by using the remaining vectors, as indicated in the derivation in STAR Methods “Determining the position vector of the unique point through which the rotation axis passes”.

Update of

Similar articles

Cited by

References

    1. Gao N, Zavialov AV, Li W, Sengupta J, Valle M, Gursky RP, Ehrenberg M, and Frank J (2005). Mechanism for the disassembly of the posttermination complex inferred from cryo-EM studies. Mol Cell 18, 663–674. 10.1016/j.molcel.2005.05.005. - DOI - PubMed
    1. Zhang Y, Mandava CS, Cao W, Li X, Zhang D, Li N, Zhang Y, Zhang X, Qin Y, and Mi K (2015). HflX is a ribosome-splitting factor rescuing stalled ribosomes under stress conditions. Nature structural & molecular biology 22, 906–913. 10.1038/nsmb.3103. - DOI - PubMed
    1. Koripella RK, Deep A, Agrawal EK, Keshavan P, Banavali NK, and Agrawal RK (2021). Distinct mechanisms of the human mitoribosome recycling and antibiotic resistance. Nat Commun 12, 3607. 10.1038/s41467-021-23726-4. - DOI - PMC - PubMed
    1. Brito Querido J, Sokabe M, Kraatz S, Gordiyenko Y, Skehel JM, Fraser CS, and Ramakrishnan V (2020). Structure of a human 48S translational initiation complex. Science 369, 1220–1227. 10.1126/science.aba4904. - DOI - PMC - PubMed
    1. Frank J (2017). Time-resolved cryo-electron microscopy: Recent progress. J Struct Biol 200, 303–306. 10.1016/j.jsb.2017.06.005. - DOI - PMC - PubMed

Publication types

MeSH terms

LinkOut - more resources