Basis of executive functions in fine-grained architecture of cortical and subcortical human brain networks
- PMID: 38244562
- PMCID: PMC10839840
- DOI: 10.1093/cercor/bhad537
Basis of executive functions in fine-grained architecture of cortical and subcortical human brain networks
Abstract
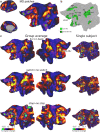
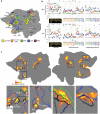
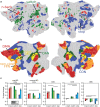
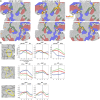
Theoretical models suggest that executive functions rely on both domain-general and domain-specific processes. Supporting this view, prior brain imaging studies have revealed that executive activations converge and diverge within broadly characterized brain networks. However, the lack of precise anatomical mappings has impeded our understanding of the interplay between domain-general and domain-specific processes. To address this challenge, we used the high-resolution multimodal magnetic resonance imaging approach of the Human Connectome Project to scan participants performing 3 canonical executive tasks: n-back, rule switching, and stop signal. The results reveal that, at the individual level, different executive activations converge within 9 domain-general territories distributed in frontal, parietal, and temporal cortices. Each task exhibits a unique topography characterized by finely detailed activation gradients within domain-general territory shifted toward adjacent resting-state networks; n-back activations shift toward the default mode, rule switching toward dorsal attention, and stop signal toward cingulo-opercular networks. Importantly, the strongest activations arise at multimodal neurobiological definitions of network borders. Matching results are seen in circumscribed regions of the caudate nucleus, thalamus, and cerebellum. The shifting peaks of local gradients at the intersection of task-specific networks provide a novel mechanistic insight into how partially-specialized networks interact with neighboring domain-general territories to generate distinct executive functions.
Keywords: cognitive control; executive functions; fMRI; multiple demand.
© The Author(s) 2024. Published by Oxford University Press.
Figures


Similar articles
-
Task modulations and clinical manifestations in the brain functional connectome in 1615 fMRI datasets.Neuroimage. 2017 Feb 15;147:243-252. doi: 10.1016/j.neuroimage.2016.11.073. Epub 2016 Dec 1. Neuroimage. 2017. PMID: 27916665
-
Inhibit, switch, and update: A within-subject fMRI investigation of executive control.Neuropsychologia. 2019 Sep;132:107134. doi: 10.1016/j.neuropsychologia.2019.107134. Epub 2019 Jul 9. Neuropsychologia. 2019. PMID: 31299188
-
Distinct and temporally associated neural mechanisms underlying concurrent, postsuccess, and posterror cognitive controls: Evidence from a stop-signal task.Hum Brain Mapp. 2021 Jun 15;42(9):2677-2690. doi: 10.1002/hbm.25347. Epub 2021 Apr 2. Hum Brain Mapp. 2021. PMID: 33797816 Free PMC article.
-
Developing brain networks of attention.Curr Opin Pediatr. 2016 Dec;28(6):720-724. doi: 10.1097/MOP.0000000000000413. Curr Opin Pediatr. 2016. PMID: 27552068 Free PMC article. Review.
-
How the Brain Creates Unity and Diversity of Executive Functions.In: Banich MT, Haber SN, Robbins TW, editors. The Frontal Cortex: Organization, Networks, and Function [Internet]. Cambridge (MA): MIT Press; 2024. Chapter 9. In: Banich MT, Haber SN, Robbins TW, editors. The Frontal Cortex: Organization, Networks, and Function [Internet]. Cambridge (MA): MIT Press; 2024. Chapter 9. PMID: 39879346 Free Books & Documents. Review.
Cited by
-
Precision mapping of the default network reveals common and distinct (inter) activity for autobiographical memory and theory of mind.J Neurophysiol. 2024 Aug 1;132(2):375-388. doi: 10.1152/jn.00427.2023. Epub 2024 Jul 3. J Neurophysiol. 2024. PMID: 38958281 Free PMC article.
-
Category-biased patches encircle core domain-general regions in the human lateral prefrontal cortex.bioRxiv [Preprint]. 2025 May 3:2025.01.16.633461. doi: 10.1101/2025.01.16.633461. bioRxiv. 2025. Update in: Neuropsychologia. 2025 Jul 29;214:109164. doi: 10.1016/j.neuropsychologia.2025.109164. PMID: 39868282 Free PMC article. Updated. Preprint.
-
Task and stimulus coding in the multiple-demand network.Cereb Cortex. 2024 Jul 3;34(7):bhae278. doi: 10.1093/cercor/bhae278. Cereb Cortex. 2024. PMID: 39004756 Free PMC article.
-
A hierarchical atlas of the human cerebellum for functional precision mapping.bioRxiv [Preprint]. 2024 Jun 1:2023.09.14.557689. doi: 10.1101/2023.09.14.557689. bioRxiv. 2024. Update in: Nat Commun. 2024 Sep 27;15(1):8376. doi: 10.1038/s41467-024-52371-w. PMID: 38260680 Free PMC article. Updated. Preprint.
-
A hierarchical Bayesian brain parcellation framework for fusion of functional imaging datasets.Imaging Neurosci (Camb). 2025 Jan 2;3:imag_a_00408. doi: 10.1162/imag_a_00408. eCollection 2025. Imaging Neurosci (Camb). 2025. PMID: 40800847 Free PMC article.
References
Publication types
MeSH terms
Grants and funding
LinkOut - more resources
Full Text Sources

