. 2024 May;166(5):787-801.e11.
doi: 10.1053/j.gastro.2024.01.016. Epub 2024 Jan 18.

Genomic Landscape of Lynch Syndrome Colorectal Neoplasia Identifies Shared Mutated Neoantigens for Immunoprevention

Affiliations

Genomic Landscape of Lynch Syndrome Colorectal Neoplasia Identifies Shared Mutated Neoantigens for Immunoprevention

Ana M Bolivar et al. Gastroenterology. 2024 May.

Abstract

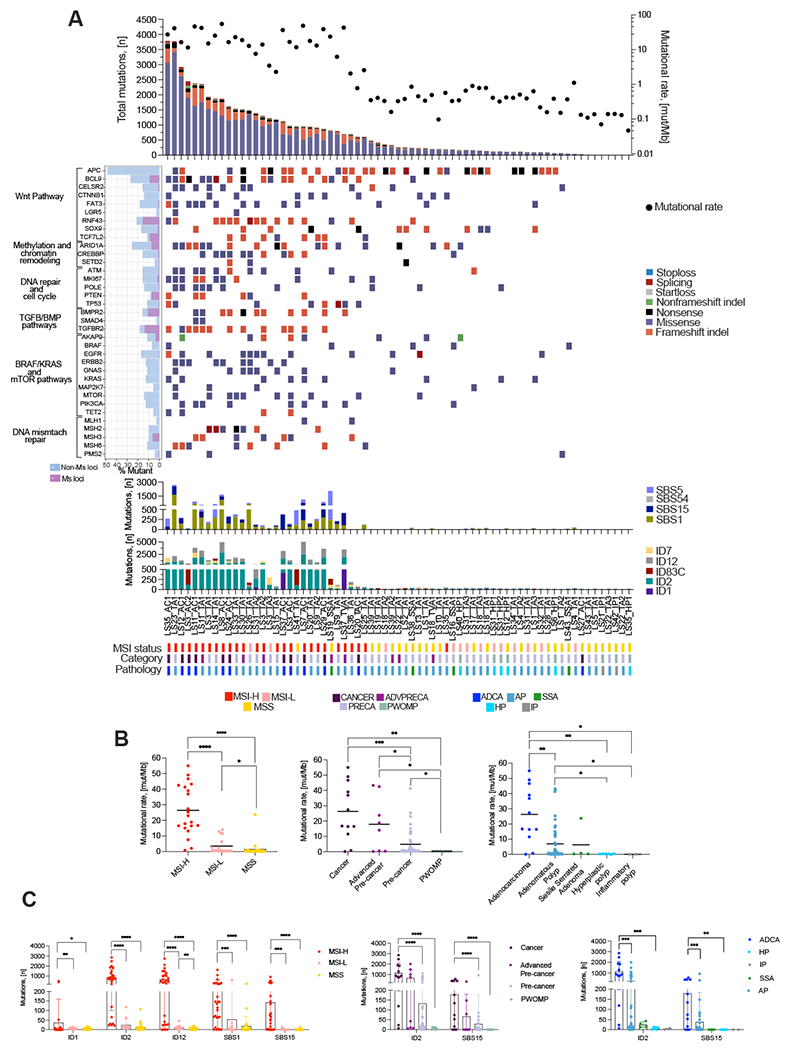
Background & aims: Lynch syndrome (LS) carriers develop mismatch repair-deficient neoplasia with high neoantigen (neoAg) rates. No detailed information on targetable neoAgs from LS precancers exists, which is crucial for vaccine development and immune-interception strategies. We report a focused somatic mutation and frameshift-neoAg landscape of microsatellite loci from colorectal polyps without malignant potential (PWOMP), precancers, and early-stage cancers in LS carriers.

Methods: We generated paired whole-exome and transcriptomic sequencing data from 8 colorectal PWOMP, 41 precancers, 8 advanced precancers, and 12 early-stage cancers of 43 LS carriers. A computational pipeline was developed to predict, rank, and prioritize the top 100 detected mutated neoAgs that were validated in vitro using ELISpot and tetramer assays.

Results: Mutation calling revealed >10 mut/Mb in 83% of cancers, 63% of advanced precancers, and 20% of precancers. Cancers displayed an average of 616 MHC-I neoAgs/sample, 294 in advanced precancers, and 107 in precancers. No neoAgs were detected in PWOMP. A total of 65% of our top 100 predicted neoAgs were immunogenic in vitro, and were present in 92% of cancers, 50% of advanced precancers, and 29% of precancers. We observed increased levels of naïve CD8+ and memory CD4+ T cells in mismatch repair-deficient cancers and precancers via transcriptomics analysis.

Conclusions: Shared frameshift-neoAgs are generated within unstable microsatellite loci at initial stages of LS carcinogenesis and can induce T-cell responses, generating opportunities for vaccine development, targeting LS precancers and early-stage cancers.

Keywords: Colorectal Cancer; Immunoprevention; Lynch Syndrome; MMR Deficiency; Neoantigen; Systems Biology.


Conflict of interest statement

Dr. Vilar had a consulting or advisory role with Janssen Research and Development, Recursion Pharma, Guardant Health, Rising Tide Foundation, and Nouscom AG. He has received research support from Janssen Research and Development. No disclosures were reported by the other authors.

Declarations: Written informed consent was obtained from all study participants and The University of Texas MD Anderson Cancer Center (MDACC) Institutional Review Board (IRB) approved this study (IRB #PA12-0327).

Figures

Figure 1.
Figure 1.. Schematic of the study.
Colonic lesions with matching normal mucosa and whole-blood from LS patients were processed for sequencing at DNA and RNA level. Using paired WES and RNAseq data, neoAgs were predicted from frameshift-indels and ranked using in-house formula. The immunogenicity of predicted neoAgs was tested using ELISPOT and tetramer assays. We provide a catalog of shared immunogenic LS-neoAgs for universal LS cancer vaccine development, the somatic mutation landscape of the largest cohort of LS cancers and pre-cancers, and their immune activation landscape at transcriptomic level.
Figure 2.
Figure 2.. MSI analysis in LS cohort.
A, The bar graph shows the number of microsatellite sites (left y-axis) with unstable sites as purple stacked bars and the stable sites as grey stacked bars. The MSI score is shown as blue circles (right y-axis). Samples with MSI score ≥ 20% are MSI-H (indicated with dotted line). The bottom panel displays MSI status as covariate bars; B, MSIscores distribution by tissue categories. MSIscore≥20% means MSI-H, MSIscore <20%, and ≥10% means MSI-L, and MSIscore<10% means MSS; C, Distribution of samples according to tissue category and MSI status; D, The panel shows the top 10 most unstable MS-loci within our sample cohort. The pink trace represents the mean allele frequency of all lesions, and the blue trace represents the mean allele frequency of all normal pairs.
Figure 3.
Figure 3.. Mutational landscape in LS samples.
A, Top panel shows the absolute count of deleterious mutations per sample on the left y-axis (colored bars), and the mutational rate (Mutations/MB) for each sample on the right x-axis (black dots). The middle grid panel shows the summary of mutations in classical CRC-associated genes. Each row represents a gene and each column a sample. Type of mutations are indicated in color as shown on the right. The bar graph on the left of the grid panel represents the percentage of samples with a deleterious mutation occurred in a MS-loci (light pink) and outside MS-loci (light blue). The bar-graphs below the grid panel show the COSMIC signatures. The bottom panel displays molecular and pathological characteristics of each sample as covariate bars. MSI-H, High microsatellite instability; MSI-L, Low microsatellite instability; MSS, Microsatellite stable; PWOMP, Polyp without malignant potential; PRECA, Pre-cancer; ADVPRECA, Advanced Pre-cancer; CANCER, Cancer; AP, Adenomatous polyp; ADCA, Adenocarcinoma (Stage I-III); SSA, Sessile serrated adenoma; HP, Hyperplastic polyp; IP, Inflammatory polyp; MB, megabase; B, The mutational rate is significantly different when samples are compared by MSI status (Mann-Whitney test ****P-value<0.0001), by disease category (Mann-Whitney test **P-value<0.01), and by pathological diagnosis (Mann-Whitney test ***P-value<0.001); C, The number of mutations that associate with the COSMIC signatures ID1, ID2, ID12, SBS1, and SBS15 are significantly different when samples are compared by MSI status (Mann-Whitney test ****P-value<0.0001), and COSMIC signatures ID2 and SBS15, when samples are compared by disease category (Mann-Whitney test ****P-value<0.0001), and pathological diagnosis (Mann-Whitney test ***P-value<0.001).
Figure 4.
Figure 4.. Landscape of neoantigens produced from frameshift-indels.
A, The bar-graphs show the number of predicted MHC-I and -II neoAgs with binding affinity <50 nM (blue), and 50 -100 nM (green), separated by MSI status. The bottom panel displays molecular and pathological characteristics of each sample as covariate bars. MSI-H, High microsatellite instability; MSI-L, Low microsatellite instability; MSS, Microsatellite stable; PWOMP, Polyp without malignant potential; PRECA, Pre-cancer; ADVPRECA, Advanced Pre-cancer; CANCER, Cancer; AP, Adenomatous polyp; ADCA, Adenocarcinoma (Stage I-III); SSA, Sessile serrated adenoma; HP, Hyperplastic polyp; IP, Inflammatory polyp; B, There is a significant difference between the number of MHC-I and MHC-II neoAgs produced by the MSI-H samples compared to the MSI-L and MSS samples (Mann-Whitney test ****P-value<0.0001); C, There is a significant difference between the number of MHC-I and MHC-II neoAgs produced by cancers compared to the advanced pre-cancers and pre-cancers (Mann-Whitney test ****P-value<0.0001); D, There is a significant difference between the number of MHC-I and MHC-II neoAgs produced by cancers compared to the other pathology diagnoses (Mann-Whitney test **P-value<0.01); E, The number of MHC-I and -II neoAgs detected per sample are positively correlated with the mutational burden (Spearman P-value<0.0001); F, Waterfall plot shows top 50 predicted MHC-I neoAgs in MSI-H samples only. The bar plot on top represents occurrence of neoAgs (neoAgs per Mb). The grid panel shows the top 50 most shared MHC-I neoAgs based on their frequency among all samples (red bars on the left) and MSI-H samples (blue bars on the left). The ranking of the predicted immunogenic neoAgs is represented with the dark blue being the 1st percentile (highest ranked immunogenic neoAgs) and the yellow being the lowest-ranked immunogenic neoAgs. The green gradient on the right shows the frequency of each neoAg within each group of patients with the given germline mutation, and the adjusted P-value (dot panel on the right) shows the lack of statistical significance of the associations between the presence of each of these neoAg and each germline mutation (the red dotted line shows the 0.05 p-value). The bottom panel displays molecular and pathological characteristics of each sample: Patient ID (top), tissue pathology, Disease category, and germline mutation (bottom) as covariate bars.
Figure 5.
Figure 5.. Immunogenicity validation of predicted neoantigens using in vitro approaches.
A, Schematic of ELISpot assays. PBMCs from healthy human donors were stimulated with individual peptides with IL-7 for 3 d, followed by expansion of neoAgs-specific T-cells with IL-2. On day 13, expanded cells (105 cells per well) were plated onto 96-well ELISpot plate coated with IFNγ antibody and re-stimulated with the respective peptide for 24 h. IFNy-secreting cells were analyzed as SFUs. Peptides with significantly higher number of SFUs (Paired Wilcoxon-Ranked Test, P-value<0.05) compared to DMSO control cells were defined as immunogenic; B, Representative well images showing IFN-γ secretion from PBMCs after stimulation with peptides; C, Immunogenic peptides generated significantly higher number of mean SFUs compared to non-immunogenic peptides after averaging all donors (Unpaired T-test ****, P-value<0.00001); D, Samples distribution according to tissue category, MSI status, and the number of immunogenic epitopes generated in each of them; E, Donor-A PBMCs (HLA-A2) were stained with anti-CD8 PerCP and a PE-conjugated RNF43_3-MHC-I tetramer (TQLARFFPI; left panel) to enrich specific HLA-A2-restricted T-cells. After gates were set on single lymphocytes and live CD3+/CD8+ cells, the enrichment of RNF43_3-MHC-I tetramer-positive and T-cell activation marker 4-1BB positive cells were shown to identify activated RNF43_3-reactive T-cells (right panel). Unstimulated T-cells were used as control; F, Levels of CD8+, CD4+, and 41BB+ cells in RNF43_3-stimulated T-cells. Each experiment was assessed through two independent assays. Results are represented as the mean percentage of CD8+, CD4+, and CD8+/41BB+ T-cells in response to RNF43_3 stimulation for all healthy human donors (n=6). Unstimulated T-cells were used as control; G, The bar graph shows the percentage of CD8+ (top panel), CD4+ (middle panel), and CD8+/41BB+ (bottom panel) T-cells, quantified from flow cytometry analysis (panel E). Statistical significance for unstimulated versus stimulated T-cells was evaluated by unpaired t-test for each healthy human donor. CD8+ T-cells: Donor-A ***P-value=0.0002; Donor-B, C, D, and E: ****P-value<0.0001; Donor-F *** P-value=0.0003. CD4+ T-cells Donor-A, E, F ****P-value<0.0001; Donor-B **P-value=0.0177. CD8/4-1BB double positive cells: ****P-value<0.0001 for all donors. Each experiment was assessed from two independent assays.
Figure 6.
Figure 6.. Differential gene expression and immune-cell deconvolution analyses between MSI-H and MSI-L/MSS samples.
A, Expression profiling of 60 differently expressed genes between MSI-H and MSI-L/MSS samples. Genes in red font are enriched in immune cells; B, ABIS Immune-cell deconvolution shows significantly different immune-cell types between MSI-H and MSI-l/MSS samples with tissue category shown by symbol color (Unpaired T-test or Mann-Whitney test, ****P-value<0.0001, **P-value<0.01, * P-value<0.05); C, Pathway enrichment analysis shows activated and suppressed pathways in MSI-H samples compared to MSI-L/MSS.

References

    1. Lynch HT, Snyder CL, Shaw TG, et al. Milestones of Lynch syndrome: 1895-2015. Nat Rev Cancer 2015;15:181–94. - PubMed
    1. Bonadona V, Bonaiti B, Olschwang S, et al. Cancer risks associated with germline mutations in MLH1, MSH2, and MSH6 genes in Lynch syndrome. JAMA 2011;305:2304–10. - PubMed
    1. Yarchoan M, Johnson BA 3rd, Lutz ER, et al. Targeting neoantigens to augment antitumour immunity. Nat Rev Cancer 2017;17:569. - PubMed
    1. Cohen CJ, Gartner JJ, Horovitz-Fried M, et al. Isolation of neoantigen-specific T cells from tumor and peripheral lymphocytes. J Clin Invest 2015;125:3981–91. - PMC - PubMed
    1. Wells DK, van Buuren MM, Dang KK, et al. Key Parameters of Tumor Epitope Immunogenicity Revealed Through a Consortium Approach Improve Neoantigen Prediction. Cell 2020;183:818–834 e13. - PMC - PubMed

Publication types

MeSH terms

LinkOut - more resources