. 2024 Jan 20;15(1):647.
doi: 10.1038/s41467-024-44877-0.

Distinguishing examples while building concepts in hippocampal and artificial networks

Affiliations

Distinguishing examples while building concepts in hippocampal and artificial networks

Louis Kang et al. Nat Commun. .

Abstract

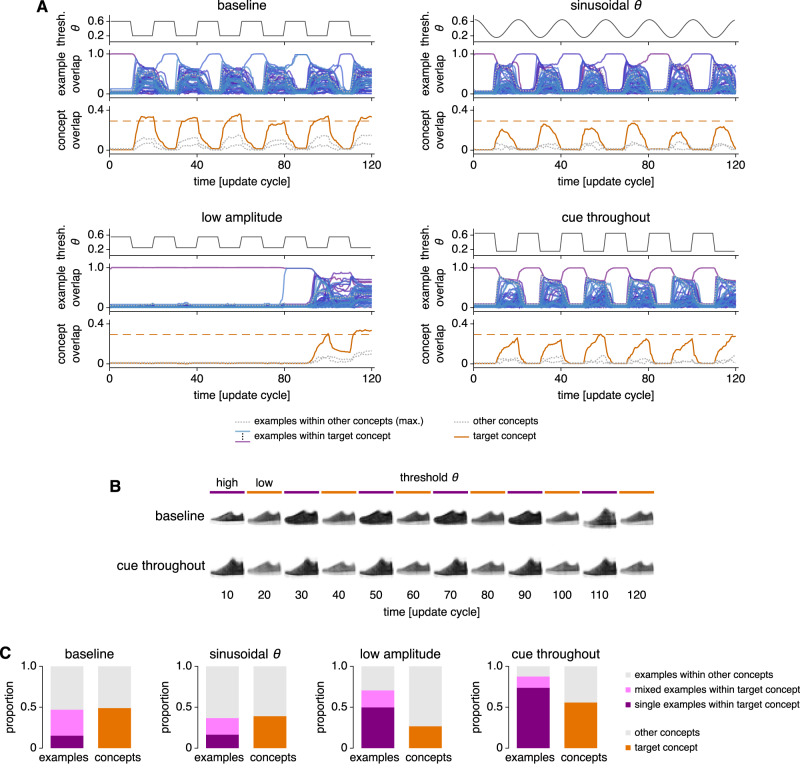
The hippocampal subfield CA3 is thought to function as an auto-associative network that stores experiences as memories. Information from these experiences arrives directly from the entorhinal cortex as well as indirectly through the dentate gyrus, which performs sparsification and decorrelation. The computational purpose for these dual input pathways has not been firmly established. We model CA3 as a Hopfield-like network that stores both dense, correlated encodings and sparse, decorrelated encodings. As more memories are stored, the former merge along shared features while the latter remain distinct. We verify our model's prediction in rat CA3 place cells, which exhibit more distinct tuning during theta phases with sparser activity. Finally, we find that neural networks trained in multitask learning benefit from a loss term that promotes both correlated and decorrelated representations. Thus, the complementary encodings we have found in CA3 can provide broad computational advantages for solving complex tasks.


Conflict of interest statement

The authors declare no competing interests.

Figures

Fig. 1
Fig. 1. Overview and motivation.
A Entorhinal cortex (EC) projects to CA3 directly via the perforant path (PP, orange) as well as indirectly through the dentate gyrus (DG) via mossy fibers (MF, purple). Adapted from Rosen GD, Williams AG, Capra JA, Connolly MT, Cruz B, Lu L, Airey DC, Kulkarni K, Williams RW (2000) The Mouse Brain Library @ https://www.mbl.org. Int Mouse Genome Conference 14: 166. https://www.mbl.org. B MF memory encodings are believed to be sparser and less correlated compared to PP encodings. In an autoassociative network, attractor basins of the former tend to remain separate and those of the latter tend to merge. C By modeling hippocampal networks, we first predict that MF and PP encodings in CA3 can respectively maintain distinctions between memories and generalize across them (Figs. 2–4). By analyzing publicly available neural recordings, we then detect signatures of these encoding properties in rat CA3 place cells (Figs. 5–7). By training artificial neural networks, we finally demonstrate that these encoding types are suited to perform the complementary tasks of example discrimination and concept classification (Fig. 8).
Fig. 2
Fig. 2. We model the transformation of memory representations along hippocampal pathways; MF and PP encodings of the same memories converge at CA3.
A Memories are FashionMNIST images, each of which is an example of a concept. B Overview of model pathways. Encoding pathways correspond to the biological architecture in Fig. 1A. Decoding pathways are used to visualize CA3 activity and are not intended to have biological significance. C We use an autoencoder with a binary middle layer to transform each memory iμν into an EC pattern xμνEC. D From EC to CA3, we use random binary connectivity matrices to transform each presynaptic pattern xμνpre to a postsynaptic pattern xμνpost. E Enforcing sparser postsynaptic patterns in D promotes decorrelation. Dark gray indicates use of xμνEC as presynaptic patterns. Points indicate means and bars indicate standard deviations over 8 random connectivity matrices. Green indicates randomly generated presynaptic patterns at various densities apre and correlations ρpre. Theoretical curves depict Eq. (1). F To visualize CA3 encodings, we pass them through a feedforward network trained to produce the corresponding xμνEC for each xμνMF and xμνPP. Images are then decoded using the autoencoder in C. Source data are provided as a Source Data file.
Fig. 3
Fig. 3. We model CA3 to store both MF and PP encodings of the same memories; MF examples remain distinct while PP examples build concept representations.
AC Overview of the Hopfield-like model for CA3. A We store linear combinations of MF and PP encodings, with greater weight on the former because MF inputs are stronger. B Retrieval begins by initializing the network to a stored pattern corrupted by flipping the activity of randomly chosen neurons. C During retrieval, the network is asynchronously updated with a threshold θ that controls the desired sparsity of the recalled pattern. D, E Retrieval behavior using MF cues. Examples from the three concepts depicted in Fig. 2A are stored. D Visualizations of retrieved patterns. MF encodings, retrieved at high θ, maintain distinct representations of examples. PP encodings, retrieved at low θ, merge into concept representations as more examples are stored (compare with average image in Fig. 2A). E Overlap of retrieved patterns with target patterns: MF examples, PP examples, or PP concepts defined by averaging over PP examples and binarizing (Methods). Solid lines indicate means, shaded regions indicate standard deviations, and the dashed orange line indicates the theoretically estimated maximum value for concept retrieval (Methods). In all networks, up to 30 cues are tested. F, G Similar to D, E, but using PP cues. H Network capacities computed using random MF and PP patterns instead of FashionMNIST encodings. Shaded regions indicate regimes of high overlap between retrieved patterns and target patterns (Supplementary Information). MF patterns have density 0.01 and correlation 0. PP patterns have density 0.5. I Similar to H, but overlaying capacities for MF examples and PP concepts to highlight the existence of regimes in which both can be recovered. Source data are provided as a Source Data file.
Fig. 4
Fig. 4. The CA3 model can alternate between MF example and PP concept representations under an oscillating threshold.
Four scenarios are considered: a baseline condition with abrupt threshold changes, sinusoidal threshold changes, threshold values of 0.55 and 0.25 instead of 0.6 and 0.2, and the weak input of an MF cue throughout the simulation instead of only at the beginning. A Pattern overlap dynamics. Each panel shows, from top to bottom, the threshold, overlaps with MF examples, and overlaps with PP concepts. The dashed orange line indicates the theoretically estimated maximum value for concept retrieval (Methods). B Visualizations of retrieved patterns show alternation between examples and concepts. In the baseline case, various examples are explored; in the cue-throughout case, the same cued example persists. C Summary of retrieval behavior between update cycles 60 to 120. For each scenario, 20 cues are tested in each of 20 networks. Each panel depicts the fractions of simulations demonstrating various example (left) and concept (right) behaviors. In all networks, 50 randomly chosen examples from each of the 3 concepts depicted in Fig. 2A are stored. One update cycle corresponds to the updating of every neuron in the network (Methods). Source data are provided as a Source Data file.
Fig. 5
Fig. 5. Place field data support the model prediction that sparser theta phases should preferentially encode finer, example-like positions.
A Our CA3 model predicts that single neurons convey more information per spike about example identity during sparse regimes. Each point represents a neuron, n = 50. B Example CA3 place cell activity along a linear track. Each spike is represented by two points at equivalent phases with histograms over position (top) and over theta phase (right). C Activity by theta phase for 5 CA3 place cells. D To test our model, we construe CA3 place cells to store fine positions as examples, which can combine into coarser regions as concepts. Here, we focus on example encoding. E Our model predicts that CA3 place fields are more sharply tuned during sparse theta phases. An alternative hypothesis is sharper tuning during dense phases. F Example phase-precessing place field. G Activity (black), raw position information per spike (blue), and mean null-matched position information (gray) by theta phase for the field in F. Sparsity-corrected position information is the difference between the raw and mean null-matched values. H Null-matched place field obtained by replacing spike positions, but not phases, with uniformly distributed random values. I Shuffled place field obtained by permuting spike phases and positions. J, K Similar to F, G, but for a place field that is not precessing. L Average difference in position information between the sparsest and densest halves of theta phases. For all cell populations, sparse phases convey more position information per spike. Each point represents a field. All and shuffled n = 35, precessing n = 21, and other n = 14. Numbers indicate p-values calculated by two-tailed Wilcoxon signed-rank tests except for the comparison between precessing and other, which is calculated by the two-tailed Mann-Whitney U test. For all results, spikes during each traveling direction are separately analyzed. In A and L, information is sparsity-corrected with horizontal lines indicating medians. Source data are provided as a Source Data file.
Fig. 6
Fig. 6. Place cell data support the model prediction that denser theta phases should preferentially encode coarser, concept-like positions.
A Our CA3 model predicts that single neurons convey more information per spike about concept identity during dense regimes. Each point represents a neuron, n = 50. B To test our model, we construe CA3 place cells to store fine positions as examples, which can combine into coarser regions as concepts. Here, we focus on concept encoding. C We calculate position information at various track scales over windows of 4 contiguous bins. D Activity (black), raw position information per spike (blue), and mean null-matched position information (gray) by theta phase for the red windows in C. Sparsity-corrected position information is the difference between the raw and mean null-matched values. E Average difference in position information between the sparsest and densest halves of theta phases. For coarser scales, dense phases convey more position information per spike. Each point represents values from a place cell averaged over all windows. Track scale 1/16 n = 47, 1/8 n = 49, and 1/4 n = 56. Numbers indicate p-values calculated by two-tailed Wilcoxon signed-rank tests for each scale and by Spearman’s ρ for the trend across scales. F Similar to E, but for shuffled data whose spike phases and positions are permuted. For all results, spikes during each traveling direction are separately analyzed. In A, E, and F, information is sparsity-corrected with horizontal lines indicating medians. Source data are provided as a Source Data file.
Fig. 7
Fig. 7. W-maze data support the model prediction that sparser theta phases should preferentially encode turn direction in addition to position.
A Same as Fig. 5A. B To test our model, we construe CA3 place cells to store turn directions during the central arm of a W-maze alternation task as examples. By combining examples, concepts that generalize over turns to solely encode position can be formed. CH Single-neuron information results. C Example place cell that is active during outward runs. Each spike is represented by two points at equivalent phases with different colors representing different future turn directions. D Activity (black), raw turn information (blue), and mean null-matched turn information (gray) by theta phase for the neuron in C. Sparsity-corrected turn information is the difference between the raw and mean null-matched values. E, F Similar to C, D, but for a place cell that is active during inward runs with colors representing past turn directions. G Average difference in turn information between the sparsest and densest halves of theta phases. For all cell populations, sparse phases convey more turn information per spike. Each point represents a place cell. All and shuffled n = 99, outward runs n = 56, and inward runs n = 43. Numbers indicate p-values calculated by two-tailed Wilcoxon signed-rank tests except for the comparison between outward and inward runs, which is calculated by the two-tailed Mann-Whitney U test. H Cumulative distribution functions for values in G.  IL Bayesian population decoding results. I Likelihood of left (L) or right (R) turns during four runs along the center arm using spikes from either the sparsest or densest halves of theta phases. J Sparse encodings exhibit greater confidence about turn direction. Vertical lines indicate medians with p-value calculated by the two-tailed Mann-Whitney U test. K Average difference in maximum likelihood estimation accuracy between the sparsest and densest halves of theta phases. Sparse phases encode turn direction more accurately. Each point represents one run averaged over decoded timepoints. All runs and shuffled n = 91. Numbers indicate p-values calculated by two-tailed Wilcoxon signed-rank tests. L Cumulative distribution functions for values in K. For all results, spikes during each traveling direction are separately analyzed. In A, G, and H, information is sparsity-corrected. Source data are provided as a Source Data file.
Fig. 8
Fig. 8. Complementary encodings inspired by CA3 can improve machine learning performance in a complex task.
A We extend the MNIST dataset by randomly assigning an additional set label to each image. BF We train a multilayer perceptron to either classify digits or identify sets. B Network architecture. Each hidden layer contains 50 neurons. C Task structures. Digit classification requires building concepts and is tested with held-out test images. Set identification requires distinguishing examples and is tested with noisy train images. D We apply the DeCorr loss function (Eq. (3)) to decorrelate encodings in the final hidden layer, in analogy with MF patterns in CA3. Without an encoding loss function, image correlations are preserved, in analogy with PP patterns. E, F DeCorr decreases concept learning performance and increases example learning performance. Points indicate means and bars indicate standard deviations over 32 networks. GJ We train a multilayer perceptron to simultaneously classify digits and identify sets. G Network architecture. Each hidden layer contains 100 neurons. The train dataset contains 1000 images and 10 sets. H We apply the HalfCorr loss function (Eq. (4)) to decorrelate encodings only among the second half of the final hidden layer. Correlated and decorrelated encodings are both present, in analogy with MF and PP patterns across the theta cycle in CA3. I DeCorr networks generally perform better at example learning but worse at concept learning compared to baseline. HalfCorr networks exhibit high performance in both tasks. Open symbols represent individual networks and filled symbols represent means over 64 networks. J Influence of each neuron in HalfCorr networks on concept and example learning, defined as the average decrease in accuracy upon clamping its activation to 0. Correlated neurons (orange bars) are more influential in concept learning, and decorrelated neurons (purple bars) are more influential in example learning. For all results, p-values are computed using unpaired two-tailed t-tests. Source data are provided as a Source Data file.

Similar articles

Cited by

References

    1. Scoville WB, Milner B. Loss of recent memory after bilateral hippocampal lesions. J. Neurol. Neurosurg. Psychiatry. 1957;20:11. doi: 10.1136/jnnp.20.1.11. - DOI - PMC - PubMed
    1. McNaughton B, Morris R. Hippocampal synaptic enhancement and information storage within a distributed memory system. Trends Neurosci. 1987;10:408–415. doi: 10.1016/0166-2236(87)90011-7. - DOI
    1. O’Reilly RC, Rudy JW. Conjunctive representations in learning and memory: Principles of cortical and hippocampal function. Psychol. Rev. 2001;108:311–345. doi: 10.1037/0033-295X.108.2.311. - DOI - PubMed
    1. Rolls ET, Kesner RP. A computational theory of hippocampal function, and empirical tests of the theory. Prog. Neurobiol. 2006;79:1–48. doi: 10.1016/j.pneurobio.2006.04.005. - DOI - PubMed
    1. Bi G-q, Poo M-m. Synaptic modifications in cultured hippocampal neurons: Dependence on spike timing, synaptic strength, and postsynaptic cell type. J. Neurosci. 1998;18:10464–10472. doi: 10.1523/JNEUROSCI.18-24-10464.1998. - DOI - PMC - PubMed