. 2024 Jan 20;15(1):633.
doi: 10.1038/s41467-024-44778-2.

Cell state dependent effects of Bmal1 on melanoma immunity and tumorigenicity

Affiliations

Cell state dependent effects of Bmal1 on melanoma immunity and tumorigenicity

Xue Zhang et al. Nat Commun. .

Abstract

The circadian clock regulator Bmal1 modulates tumorigenesis, but its reported effects are inconsistent. Here, we show that Bmal1 has a context-dependent role in mouse melanoma tumor growth. Loss of Bmal1 in YUMM2.1 or B16-F10 melanoma cells eliminates clock function and diminishes hypoxic gene expression and tumorigenesis, which could be rescued by ectopic expression of HIF1α in YUMM2.1 cells. By contrast, over-expressed wild-type or a transcriptionally inactive mutant Bmal1 non-canonically sequester myosin heavy chain 9 (Myh9) to increase MRTF-SRF activity and AP-1 transcriptional signature, and shift YUMM2.1 cells from a Sox10high to a Sox9high immune resistant, mesenchymal cell state that is found in human melanomas. Our work describes a link between Bmal1, Myh9, mouse melanoma cell plasticity, and tumor immunity. This connection may underlie cancer therapeutic resistance and underpin the link between the circadian clock, MRTF-SRF and the cytoskeleton.


Conflict of interest statement

The authors declare no competing interests.

Figures
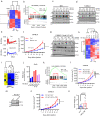
Fig. 1
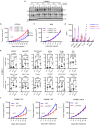
Fig. 1. Loss of Bmal1 decreases YUMM2.1 tumorigenesis.
a Heatmap for DEGs in B16 Control (Ctrl) vs B16 Bmal1-null (KO) cells. BR of 2. b GSEA showing hypoxia gene set significantly enriched in B16 Control vs Bmal1 KO. c, d Immunoblot of Bmal1, Hif1α and Sox9 proteins in Ctrl and Bmal1 KO clones from B16 cells (c) or YUMM2.1 cells (d) at different time points after exposure to 3% O2. α-Tubulin served as loading control for all immunoblots except where noted. RE of 3 for c and 2 for d. e Real-time luminescence monitoring of Bmal1::dLUC in YUMM2.1 Bmal1 KO clone aC3 and control clone B8 synchronized with dexamethasone for up to 4.5 days. Luminescence signal is baseline subtracted and data are shown starting 24 h after synchronization. Signal confidence interval is shown in gray. Mean ± SEM of BR of 3, RE of 2. f Tumor growth rate of B8 (n = 7) and aC3 clones in male C57BL/6 mice (n = 8). Mean ± SEM; ****P < 0.0001 by Two-way ANOVA test. g Immunoblot for Bmal1, Hif1α and Sox9 protein levels in Bmal1 KO aC3 clone with empty vector (EV), WT-Bmal1 and dHLH-Bmal1. RE of 3. hk Quant-seq data analyses from aC3 clone with EV, WT-Bmal1 and dHLH-Bmal1. Samples are in duplicates. Heatmap for all 47 increased and 103 decreased genes by WT-Bmal1 but not dHLH-Bmal1 vs EV (h); Heatmap for relative expression of Bmal1 direct target genes (i); Normalized counts of Sox9 (j) and GSEA showing the enrichment of hypoxia gene set with WT-Bmal1 vs EV cells (k). l Tumor growth rate of aC3 with EV (n = 14), WT-Bmal1 (n = 15) and dHLH-Bmal1 (n = 14) in male C57BL/6 mice. Mean ± SEM, RE of 2. ****p < 0.0001 by Two-way ANOVA test followed by Tukey’s multiple comparisons test. m Immunoblot for Hif1α in aC3 clone with EV* and Hif1α-TM. Note: aC3 EV* is different from aC3 EV which has Bmal1::dLuc reporter. RE of 2. Tumor growth rate (n) and tumor weight (o) of aC3 with EV* and Hif1α-TM in male C57BL/6 mice (n = 10 in each group). Mean ± SEM. p-value by Two-way ANOVA test in n. Mean ± SEM. Two-tailed p-value by unpaired t-test in o. RE of 2. BR = biological replicate, RE = replicate experiment. Source data are provided as a Source Data file.
Fig. 2
Fig. 2. Ectopic Expression of Bmal1 Affects Immune Infiltration and Accelerates Tumorigenesis of YUMM2.1.
a Immunoblot for Hif1α and Bmal1 in YUMM2.1 with EV, WT-Bmal1 and dHLH-Bmal1. RE of 2. b, c Tumor growth rates of YUMM2.1 EV, WT-Bmal1 and dHLH-Bmal1 in male C57BL/6 mice (b; n = 9) or NSG mice (c; n = 8). Mean ± SEM. RE of 3 in b. RE of 2 in c. ****p < 0.0001 by Two-way ANOVA test followed by Tukey’s multiple comparisons test. d The level of cytokines secreted from YUMM2.1 EV, WT-Bmal1 and dHLH-Bmal1 cells as determined by immunoassay (RayBiotech, Mouse Cytokine Array 1000, QAM-CYT-1000). BR of 2. Each dot represents one biologically independent sample. e Flow cytometric immunophenotyping of YUMM2.1 EV (n = 8), WT-Bmal1 (n = 7) and dHLH-Bmal1 (n = 7) tumors in C57BL/6 mice. Mean ± SEM. p-value by one-way ANOVA test followed by multiple comparison test. f Response of YUMM2.1 EV (n = 11 each treatment), WT-Bmal1 (n = 14 each treatment) and dHLH-Bmal1 (n = 14 each treatment) tumors in male C57BL/6 mice to control IgG or anti-PD1 treatment given IP every 3 days. Mean ± SEM. ****p < 0.0001 by Two-way ANOVA test. BR = biological replicate, RE = replicate experiment. Source data are provided as a Source Data file.
Fig. 3
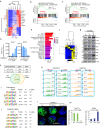
Fig. 3. Ectopic Expression of Bmal1 Induces Sox10high YUMM2.1 Cells toward Sox9high More Mesenchymal Cell State.
af Analyses of RNA-seq data from YUMM2.1 EV, WT-Bmal1 and dHLH-Bmal1 cells. BR of 2. a Heatmap for all genes that are affected by WT-Bmal1 and dHLH-Bmal1 in the same direction versus EV in YUMM2.1. GSEA showing significantly enriched epithelial mesenchymal transition (EMT) gene set in YUMM2.1 WT-Bmal1 vs EV (b) and YUMM2.1 dHLH-Bmal1 vs EV (c). Adjust p-value by one-sided Fisher’s exact test which applied to all GSEA unless noted. d Expression of Sox9 and Sox10 mRNA level. e Transcription factor motif enrichment among 542 genes that progressively increased from YUMM2.1 EV to WT-Bmal1 and to dHLH-Bmal1 cells shown in Fig. 3a. Adjust p-value by one-sided Fisher’s exact test which applied to all transcription factor motif enrichment analysis unless noted. f Heatmap of AP-1 factors. g Immunoblot for Bmal1 and AP-1 factors in YUMM2.1 with EV, WT-Bmal1 and dHLH-Bmal1. Numbers underneath the rows represent relative expression of proteins on different gels but from the same experiment. RE of 3. hj H3K27Ac ChIP-seq analysis of YUMM2.1 WT-Bmal1 and YUMM2.1 dHLH-Bmal1 versus YUMM2.1 EV. BR of 2. Gain or loss of H3K27Ac signals in YUMM2.1 cells with WT-Bmal1 and dHLH-Bmal1 versus EV (h). Prevalence of bZIP (AP-1) motif in all 1187 regions (i) and 131 intergenic regions (>20 kb from TSS) (j). Nominal p-value by one-sided hypergeometrical test. k H3K4me3 and H3K27Ac alterations at Sox9 and Sox10 loci in YUMM2.1 cells with WT-Bmal1 and dHLH-Bmal1 versus EV. BR of 2. l CyCIF for Sox9 (green) and Sox10 (Blue) on tissue microarray of independent tumors from YUMM2.1 EV, WT-Bma1 and dHLH-Bmal1 tumors in C57BL/6 mice. Each circular section was from a different tumor. Source data for CyCIF as Minerva story available at www.cycif.org/data/zhang-2023m Percentage of tumor cells positive for Sox10 and Sox9 respectively in YUMM2.1 EV, WT-Bmal1 or dHLH-Bmal1 tumor tissues determined by CyCIF. Each dot represents one tumor tissue (n = 2). BR = biological replicate, RE = replicate experiment. Source data are provided as a Source Data file.
Fig. 4
Fig. 4. Bmal1 Interacts with Myh9 in Nucleus.
a Upper panel: Diagram of TurboID fusion proteins. Tb: 3 Hemagglutinin (HA) tags fused to the 5’ end of TurboID; TbNLS: Nuclear localization signal fused to the 3′ end of Tb; TbWT: WT-Bmal1 fused to the 3′ end of Tb; TbdHLH: dHLH-Bmal1 fused to the 3′ end of Tb. Created with BioRender.com. Lower panel: Immunoblot for HA and Clock with whole cell lysate (Input) and proteins pulled down with HA antibody (IP: HA) from cells: KO aC3-Tb, KO aC3-TbNLS, KO aC3-TbWT and KO aC3-TbdHLH. Numbers underneath the rows represent relative expression. RE of 3. b Heatmap of peptide intensities for proteins that were biotinylated, pulled down, and digested from streptavidin beads. Enriched labeled proteins were from cells (shown in Fig. 4a) exposed to biotin and identified by LC-MS/MS analysis. No biotin treated samples were used as negative control for endogenously biotinylated proteins. BR of 2. c Peptide intensities for Clock (inset), Myh9, Actn4, and Gapdh are shown from Fig. 4b. d Immunoblot of proteins that were co-immunoprecipitated by BMAL1 antibody from nuclear extracts of cross-linked YUMM2.1 EV, YUMM2.1 WT-Bma1 and YUMM2.1 dHLH-Bmal1 cells. Normal rabbit IgG was used as antibody control; Clock and Ezh2 were separately used as positive and negative control for immunoprecipitation. RE of 3. e Immunoblot of proteins co-immunoprecipitated by Flag antibody from 293 T cells without (−) or with different Myh9 constructs (FL: Full length of Myh9 without Flag tag; Flag-tagged Myh9 Head; Flag-tagged Myh9 Tail) and Bmal1 overexpression. RE of 3. f Bmal1 and Myh9 in situ interaction in YUMM2.1 EV, WT-Bmal1 and dHLH-Bmal1 detected by Proximity Ligation Assay (PLA) using anti-Bmal1 and anti-Myh9 antibodies. Fluorescent micrographs show nuclear staining with DAPI (blue) and PLA signal (red). RE of 2. g Mean fluorescence intensity (MFI) of nuclear PLA signals from YUMM2.1 EV (n = 66), WT-Bmal1 (n = 43) and dHLH-Bmal1 (n = 38) cells. Mean ± SEM. Adjust p-value by one-way ANOVA test followed by multiple comparison test. BR = biological replicate, RE = replicate experiment. Source data are provided as a Source Data file.
Fig. 5
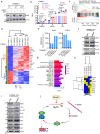
Fig. 5. Bmal1 and Myh9 Interaction Increases MRTF-SRF Activity and Drives Cell State Change.
a Upper panel: Diagram illustrating the interaction between Myh9, Actin and MRTF-SRF signal pathway. Myh9 (Myosin IIA) formed bipolar filaments binding to F-actin which can depolymerize into monomer G-actin. G-actin can bind to SRF cofactor MRTF to inhibit MRTF-SRF transcriptional activity. Lower panel: the diagram of SRF-RE Luciferase reporter to examine the activity of MRTF-SRF pathway. Created with BioRender.com. b, c Flow cytometry analysis of G-actin stained with Alexa594-conjugated DNaseI in YUMM2.1 EV, YUMM2.1 WT-Bmal1 and YUMM2.1 dHLH-Bmal1 cells. Data (b) represents 4 independent experiments which were quantified in (c). Data was normalized to EV. Mean ± SEM. Adjust p-value by one-way ANOVA test followed by multiple comparison test. d Relative luminescence (RLU) from YUMM2.1 EV, WT-Bmal1 and dHLH-Bmal1 cells that were transiently transfected with SRF-RE luciferase and Renilla luciferase plasmids and followed by treatment with 10 nM Trametinib (MEKi) for 20 h or 2 µM Cytochalasin D (CD) for 2 h. DMSO was the 20 h treatment control. Mean ± SEM of 6 BR. RE of 4. Adjust p-value by one-way ANOVA test followed by multiple comparisons test. ****p < 0.0001. BR biological replicate, RE replicate experiment. Source data are provided as a Source Data file.
Fig. 6
Fig. 6. Myh9 Knockdown Drives YUMM2.1 Cells to More Mesenchymal Cell State.
a Immunoblot of Myh9 in YUMM2.1 EV, YUMM2.1 WT-Bmal1 and YUMM2.1 dHLH-Bmal1 cells with shNC or shMyh9. RE of 3. b Relative luminescence (RLU) from cells EV shNC, EV shMyh9, WT-Bmal1 shNC and dHLH-Bmal1 shNC respectively transiently transfected with SRF-RE luciferase and Renilla luciferase plasmids and treated with 10 nM Trametinib (MEKi) or 2 µM Cytochalasin D (CD) for 20 or 2 h, respectively. DMSO was a control for 20 h treatment. Mean ± SEM of 3 BR. RE of 3. Adjust p-value by one-way ANOVA test followed by multiple comparisons test. ****p < 0.0001. ce RNA-seq analyses of YUMM2.1 EV with shNC, shMyh9, YUMM2.1 WT-Bmal1 with shNC and YUMM2.1 dHLH-Bmal1 shNC. Samples are from biological duplicates. c GSEA showing enrichment of EMT genes with shMyh9 versus shNC in YUMM2.1 EV cells. d Heatmap for 627 overlapping genes shown in Supplementary Fig. 5d. e Expression Sox9 and Sox10 mRNA level in YUMM2.1 EV cells with shNC and shMyh9. f Immunoblot for Myh9, Bmal1, Sox9 and Sox10 in YUMM2.1 EV with shNC and shMyh9. RE of 3. g Transcription factor motif enrichment among 413 up-regulated genes shown in Fig. 5d. h Heatmap for AP-1 factors from duplicated Quant-seq data of YUMM2.1 EV shNC and shMyh9. i Immunoblot of Myh9 and AP-1 factors in YUMM2.1 EV shNC and shMyh9. RE of 3. Numbers underneath the rows represent relative expression of proteins on different gels but from the same experiment. j Cartoon illustrating the negative feedback loop in which Myh9 as a target gene of MRTF-SRF, suppresses MRTF-SRF activity through regulating MRTF and G-actin interaction. Created with BioRender.com. BR = biological replicate, RE = replicate experiment. Source data are provided as a Source Data file.
Fig. 7
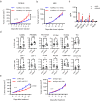
Fig. 7. Loss of Myh9 Affects Immune infiltration and Increases Tumorigenesis of YUMM2.1.
a In vivo tumorigenesis of YUMM2.1 EV with shNC or shMyh9 in male C57BL/6 mice (n = 10 each group). Mean ± SEM. ****p-value < 0.0001 by Two-way ANOVA test. RE of 2. b In vivo tumorigenesis of YUMM2.1 EV with shNC or shMyh9 in male NSG mice (n = 8 each group). Mean ± SEM. RE of 2. c The level of cytokines secreted from YUMM2.1 EV cells with shNC or shMyh9 as determined by immunoassay. BR of 2. Each dot represents one biologically independent sample. d Flow cytometric immunophenotyping of tumors formed with YUMM2.1 EV with shNC or shMyh9 cells in C57BL/6 mice (Fig. 7a). Mean ± SEM. Two-tailed p-value by unpaired t-test. e Response of YUMM2.1 EV shNC and shMyh9 tumors in C57BL/6 mice to control IgG and anti-PD1 treatment given IP every 3 days (n = 7 each group). Mean ± SEM. p value by Two-way ANOVA test. BR = biological replicate, RE = replicate experiment. Source data are provided as a Source Data file.

References

    1. Allada R, Bass J. Circadian mechanisms in medicine. N. Engl. J. Med. 2021;384:550–561. doi: 10.1056/NEJMra1802337. - DOI - PMC - PubMed
    1. Bass J, Lazar MA. Circadian time signatures of fitness and disease. Science. 2016;354:994–999. doi: 10.1126/science.aah4965. - DOI - PubMed
    1. Panda S. Circadian physiology of metabolism. Science. 2016;354:1008–1015. doi: 10.1126/science.aah4967. - DOI - PMC - PubMed
    1. Kondratov RV, Kondratova AA, Gorbacheva VY, Vykhovanets OV, Antoch MP. Early aging and age-related pathologies in mice deficient in BMAL1, the core componentof the circadian clock. Genes Dev. 2006;20:1868–1873. doi: 10.1101/gad.1432206. - DOI - PMC - PubMed
    1. Sancar, A. & Van Gelder, R.N. Clocks, cancer, and chronochemotherapy. Science371, eabb0738 (2021). - PubMed

Substances