

Abnormal developmental of structural covariance networks in young adults with heavy cannabis use: a 3-year follow-up study
- PMID: 38245512
- PMCID: PMC10799944
- DOI: 10.1038/s41398-024-02764-8
Abnormal developmental of structural covariance networks in young adults with heavy cannabis use: a 3-year follow-up study
Abstract
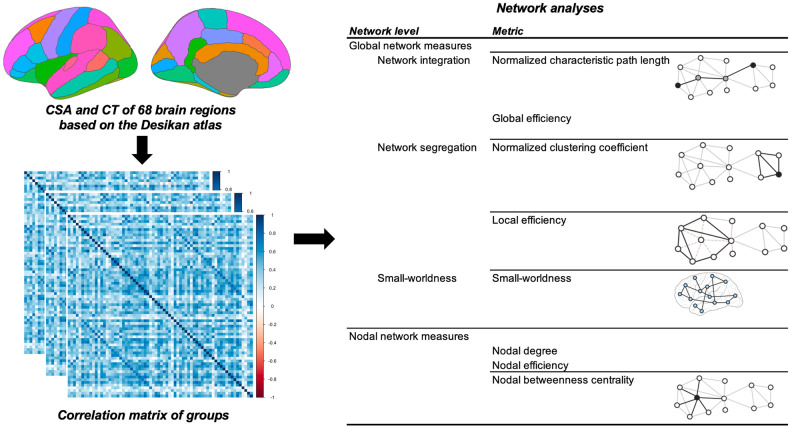
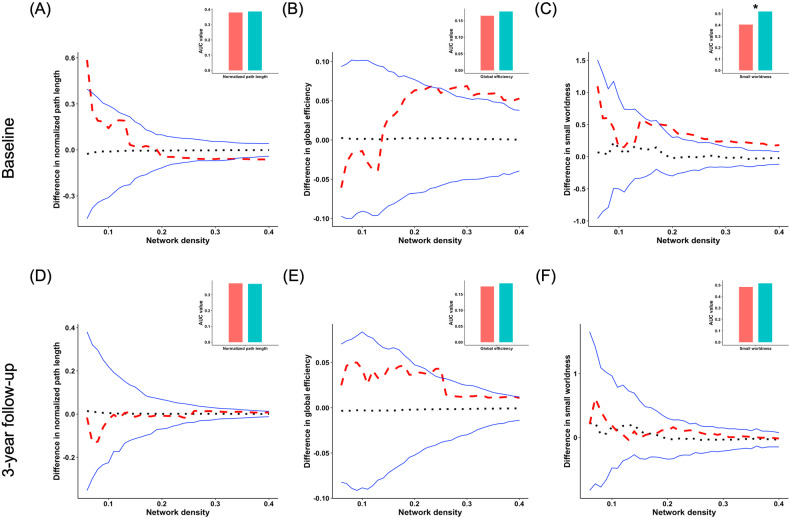
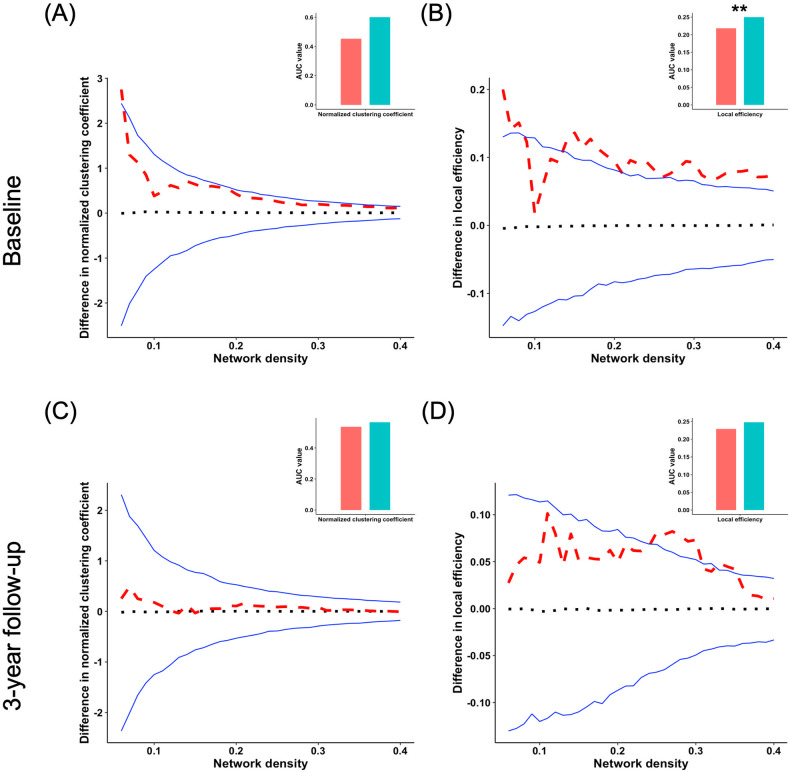
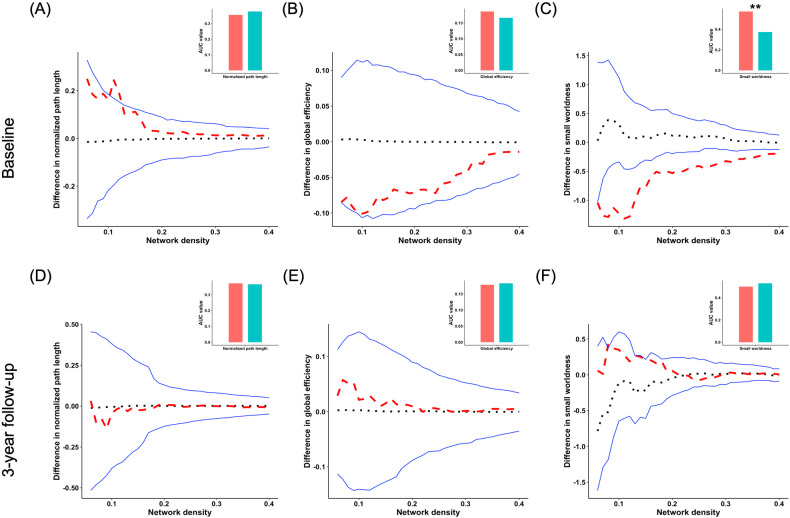
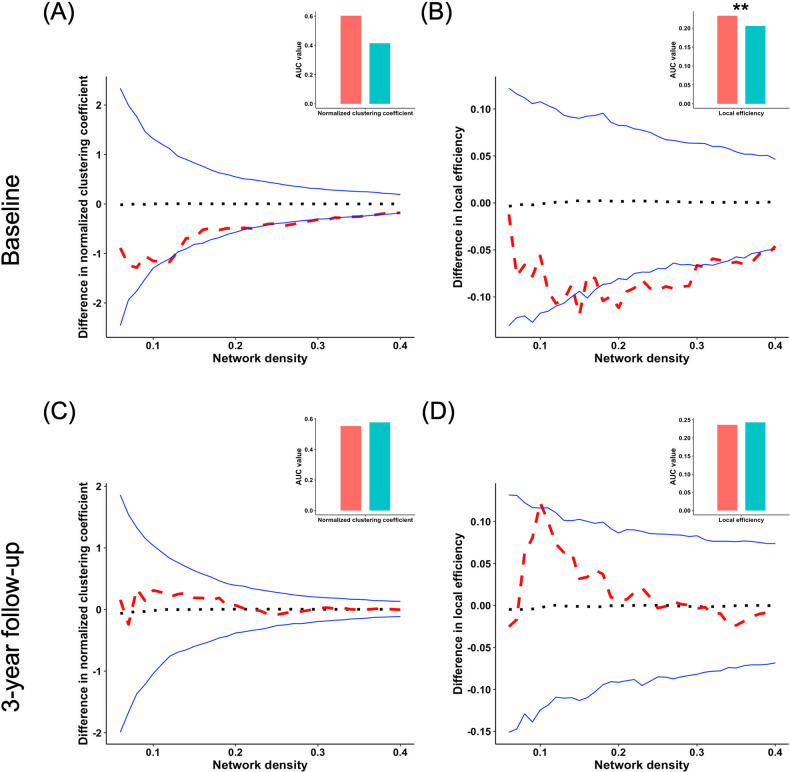
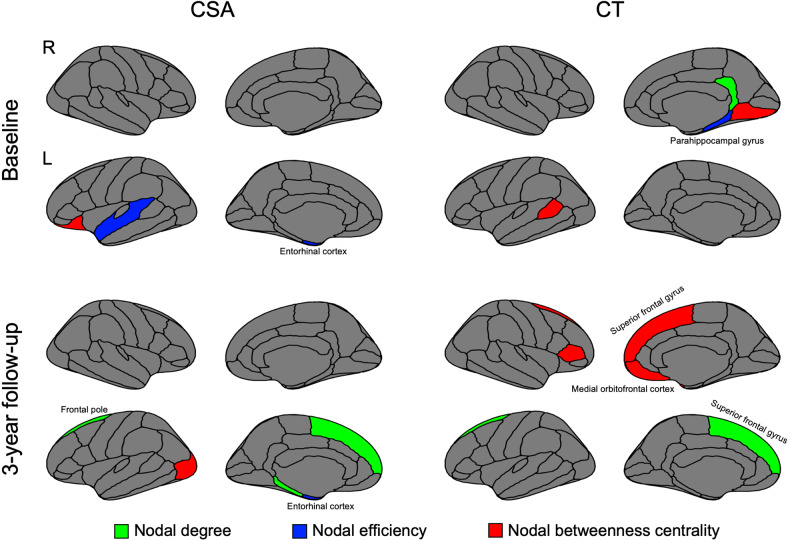
Heavy cannabis use (HCU) exerts adverse effects on the brain. Structural covariance networks (SCNs) that illustrate coordinated regional maturation patterns are extensively employed to examine abnormalities in brain structure. Nevertheless, the unexplored aspect remains the developmental alterations of SCNs in young adults with HCU for three years, from the baseline (BL) to the 3-year follow-up (FU). These changes demonstrate dynamic development and hold potential as biomarkers. A total of 20 young adults with HCU and 22 matched controls were recruited. All participants underwent magnetic resonance imaging (MRI) scans at both the BL and FU and were evaluated using clinical measures. Both groups used cortical thickness (CT) and cortical surface area (CSA) to construct structural covariance matrices. Subsequently, global and nodal network measures of SCNs were computed based on these matrices. Regarding global network measures, the BL assessment revealed significant deviations in small-worldness and local efficiency of CT and CSA in young adults with HCU compared to controls. However, no significant differences between the two groups were observed at the FU evaluation. Young adults with HCU displayed changes in nodal network measures across various brain regions during the transition from BL to FU. These alterations included abnormal nodal degree, nodal efficiency, and nodal betweenness in widespread areas such as the entorhinal cortex, superior frontal gyrus, and parahippocampal cortex. These findings suggest that the topography of CT and CSA plays a role in the typical structural covariance topology of the brain. Furthermore, these results indicate the effect of HCU on the developmental changes of SCNs in young adults.
© 2024. The Author(s).
Conflict of interest statement
The authors declare no competing interests.
Figures
Similar articles
-
Altered gray matter structural covariance networks in young adults with obesity.Int J Obes (Lond). 2025 May;49(5):801-808. doi: 10.1038/s41366-024-01703-3. Epub 2024 Dec 18. Int J Obes (Lond). 2025. PMID: 39695278
-
Abnormal structural covariance networks in young adults with recent cannabis use.Addict Behav. 2024 Aug;155:108029. doi: 10.1016/j.addbeh.2024.108029. Epub 2024 Apr 8. Addict Behav. 2024. PMID: 38593597
-
Abnormal Cortical Thickness Development in Young Adults With Heavy Cannabis Use: A Longitudinal Study.Addict Biol. 2025 May;30(5):e70040. doi: 10.1111/adb.70040. Addict Biol. 2025. PMID: 40344353 Free PMC article.
-
Abnormal longitudinal changes of structural covariance networks of cortical thickness in mild traumatic brain injury with posttraumatic headache.Prog Neuropsychopharmacol Biol Psychiatry. 2024 Jul 13;133:111012. doi: 10.1016/j.pnpbp.2024.111012. Epub 2024 Apr 17. Prog Neuropsychopharmacol Biol Psychiatry. 2024. PMID: 38641235
-
Altered cortical thickness and structural covariance networks in chronic low back pain.Brain Res Bull. 2024 Jun 15;212:110968. doi: 10.1016/j.brainresbull.2024.110968. Epub 2024 Apr 27. Brain Res Bull. 2024. PMID: 38679110
Cited by
-
Abnormal topological structure of structural covariance networks based on fractal dimension in noise induced hearing loss.Sci Rep. 2024 Nov 28;14(1):29644. doi: 10.1038/s41598-024-80731-5. Sci Rep. 2024. PMID: 39609512 Free PMC article.
-
Altered gray matter structural covariance networks in young adults with obesity.Int J Obes (Lond). 2025 May;49(5):801-808. doi: 10.1038/s41366-024-01703-3. Epub 2024 Dec 18. Int J Obes (Lond). 2025. PMID: 39695278
-
How short video addiction affects risk decision-making behavior in college students based on fNIRS technology.Front Hum Neurosci. 2025 Apr 7;19:1542271. doi: 10.3389/fnhum.2025.1542271. eCollection 2025. Front Hum Neurosci. 2025. PMID: 40270566 Free PMC article.
-
Abnormalities of cortical morphology and structural covariance network in the patients with primary trigeminal neuralgia: a preliminary clinical study.Neurol Sci. 2025 Jul 15. doi: 10.1007/s10072-025-08360-y. Online ahead of print. Neurol Sci. 2025. PMID: 40663271
References
MeSH terms
Grants and funding
LinkOut - more resources
Full Text Sources
