. 2024 Jan 20;10(1):5.
doi: 10.1038/s41522-023-00472-7.

Endogenous Coriobacteriaceae enriched by a high-fat diet promotes colorectal tumorigenesis through the CPT1A-ERK axis

Affiliations

Endogenous Coriobacteriaceae enriched by a high-fat diet promotes colorectal tumorigenesis through the CPT1A-ERK axis

Qiulin Tang et al. NPJ Biofilms Microbiomes. .

Abstract

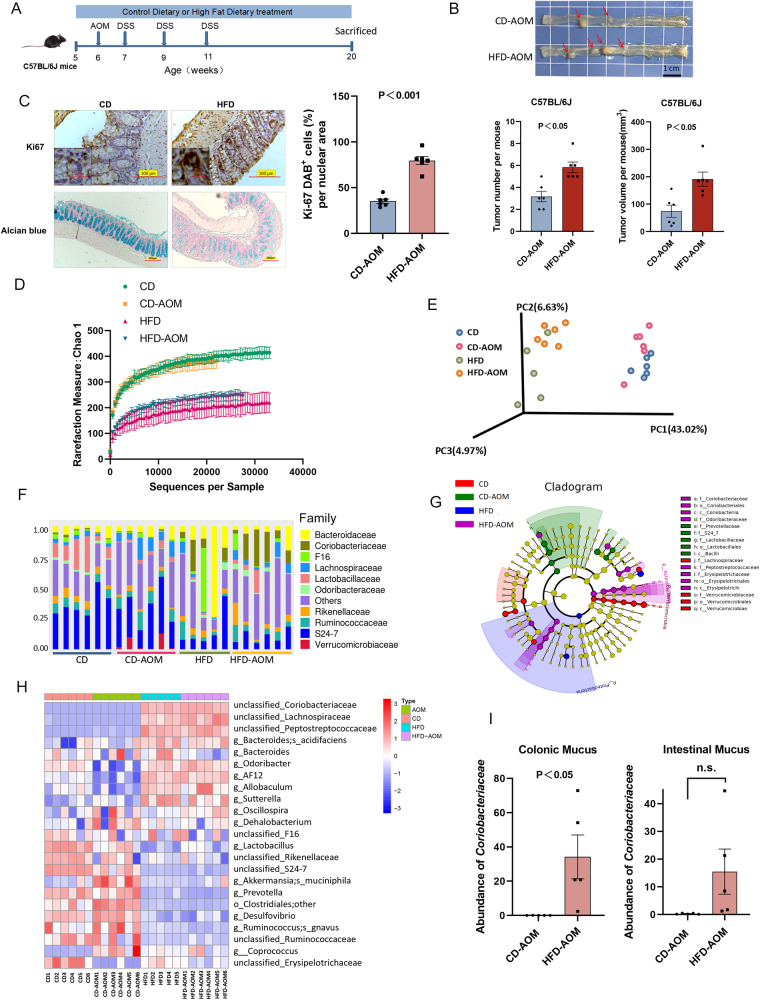
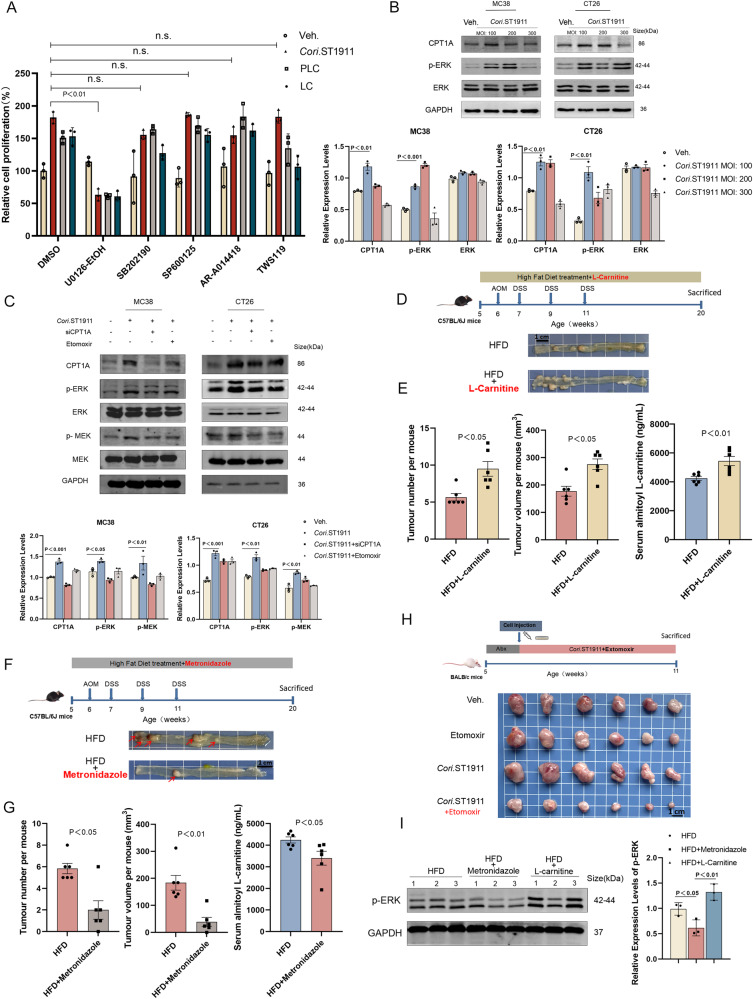
A high-fat diet (HFD) may be linked to an increased colorectal cancer (CRC) risk. Stem cell proliferation and adipokine release under inflammatory and obese conditions are the main factors regulating CRC progression. Furthermore, alterations in intestinal flora have been linked to tumorigenesis and tumour progression. However, whether a HFD can promote CRC occurrence by altering intestinal flora remains unclear. The objective of this study was to identify bacterial strains enriched by a HFD and investigate the association and mechanism by which a HFD and bacterial enrichment promote CRC occurrence and development. In this study, the intestinal microbiota of mice was assessed using 16S rRNA and metagenomic sequencing. Serum metabolites of HFD-fed mice were assessed using tandem liquid chromatography-mass spectrometry. CRC cell lines and organoids were co-cultured with Coriobacteriaceae to evaluate the effect of these bacteria on the CPT1A-ERK signalling pathway. We found that Coriobacteriaceae were enriched in the colons of HFD-fed mice. An endogenous Coriobacteriaceae strain, designated as Cori.ST1911, was successfully isolated and cultured from the stools of HFD-fed mice, and the tumorigenic potential of Cori.ST1911 in CRC was validated in several CRC mouse models. Furthermore, Cori.ST1911 increased acylcarnitine levels by activating CPT1A, demonstrating the involvement of the CPT1A-ERK axis. We also found that the endogenous Lactobacillus strain La.mu730 can interfere with Cori.ST1911 colonisation and restore gut barrier function. In conclusion, we identified a novel endogenous intestinal Coriobacteriaceae, Cori.ST1911, which might lead to a new gut microbiota intervention strategy for the prevention and treatment of CRC.


Conflict of interest statement

The authors declare no competing interests.

Figures

Fig. 1
Fig. 1. A high-fat diet is related to intestinal microbiota disruption and promotes colon cancer development in C57 mice.
A Schematic diagram of the experimental procedure of AOM-DSS treatment of CD- and HFD-fed C57BL/6J mice. Six-week-old mice received a single intraperitoneal (i.p.) AOM (10 mg/kg) injection and three cycles of 1.5% DSS drinking water to establish the mouse primary colon cancer model. The mice were simultaneously fed a HFD (n = 6) or normal CD (n = 6) for 14 weeks. B Representative image of colon tumours in CD- and HFD-fed C57BL/6J AOM mice. C. Alcian blue staining (×10 magnification) and Ki67 expression (×20 magnification) in CD- and HFD-fed C57BL/6J AOM mice. Scale bars, 200 μm. DH 16S rRNA sequencing of faecal microbiota of CD (n = 6), CD-AOM (n = 6), HFD (n = 5), and HFD-AOM (n = 6) mice at 20 weeks. D Colonic microbiota α-diversity curve (Chao1) of CD- and HFD-fed C57BL/6J AOM mice analysed with the Kruskal–Wallis test. E Unifrac PCoA of microbiota in CD- and HFD-fed C57BL/6J AOM mice. F Distribution of intestinal microbiota in each sample (grouping) of CD- and HFD-fed C57BL/6J AOM mice. G Cladogram of evolutionary branches of each level among CD- and HFD-fed C57BL/6J AOM mice using LEfSe analysis. The vertical axis represents the relative abundance of different species, the horizontal axis represents grouping information. H OTU heatmap in CD- and HFD-fed C57BL/6J AOM mice. The counts were log-transformed and used to define the heatmap colour gradient. I Coriobacteriaceae abundance in the small intestinal (left) and colonic (right) mucus of CD- and HFD-fed C57BL/6J AOM mice determined using qPCR, normalised to universal bacterial primers by targeting 16S rRNA genes (n = 5). Data are represented as mean ± SEM, analysed using the two-tailed Student’s t-test. AOM, azoxymethane; DSS, dextran sodium sulfate; CD, control diet; HFD, high-fat diet; OTU, operational taxonomic unit; LEfSe, linear discriminant analysis effect size; PCoA, principal coordinate analysis.
Fig. 2
Fig. 2. Endogenous Coriobacteriaceae strain Cori.ST1911 isolated from the stool of HFD-fed mice was related to the enrichment of unclassified Coriobacteriaceae.
A Schematic diagram of the experimental procedure for Cori.ST1911 isolation and 16S rRNA and macrogenomic sequencing analysis to confirm its dominant position in the Coriobacteriaceae family. Data are represented as mean ± SEM, analysed using the two-tailed Student’s t-test. B Cori.ST1911 genome top 10 species distribution from the NR database. C Framing phylogeny evolutionary tree of the Coriobacteriaceae family and the Cori.ST1911 isolate. D Electron microscopic image showing typical morphological characteristics of Cori.ST1911. Scale bars, 3 µm (left), 2 µm (right). E Growth curves of Cori.ST1911. E. coli was used as a control. F Coriobacteriaceae abundance in stool (left) and Muc2 expression in mucus (right) of CD- and HFD-fed C57BL/6J AOM mice at 0, 4, and 8 weeks determined using qPCR. Data are represented as mean ± SEM, analysed using the two-tailed Student’s t-test. NR, non-redundant; OD, optical density.
Fig. 3
Fig. 3. Cori.ST1911 promotes colon cancer tumorigenesis and development in different mouse models.
A Schematic diagram of the experimental procedure for constructing C57BL/6J AOM mouse models and representative colon tumour images. B Cori.ST1911 abundance at 0, 1, 2, and 4 weeks determined using qPCR and normalised to universal bacterial primers by targeting 16S rRNA genes. C Tumour number and volume in C57BL/6J AOM mice (n = 5) gavaged with Cori.ST1911, E. coli, or vehicle. Data are represented as mean ± SEM, analysed using one-way ANOVA. n.s., no significance. D Representative images of HE and nuclear Ki67 staining of the Cori.ST1911 group and GAM broth control group mice. Scale bars, 200 µm. Percentage of nuclear Ki67+ cells (n = 5). Data are represented as mean ± SEM, analysed using two-tailed Student’s t-test. E Schematic diagram of the experimental procedure for constructing model ApcMin/+ mice and representative colon tumour images. F Tumour number and volume in ApcMin/+ mice (n = 5) gavaged with Cori.ST1911, Cori.ST1911 culture supernatant, or vehicle. Data are represented as mean ± SEM, analysed using one-way ANOVA. n.s., no significance. G Schematic diagram of the experimental procedure for constructing a subcutaneous transplanted tumour model in BALB/c mice and representative colon tumour images. Mice inoculated with CT26 cells were randomly assigned to Cori.ST1911 and GAM broth control groups when the tumour reached 3–4 mm. Tumour tissue was harvested 5 weeks later. H Tumour weight and volume in BALB/c mice gavaged with Cori.ST1911 or vehicle. Data are represented as mean ± SEM, analysed using two-tailed Student’s t-test. SUP, supernatant.
Fig. 4
Fig. 4. Enrichment of metabolite acylcarnitine is induced by Coriobacteriaceae through CPT1A upregulation.
A Clustering analysis of ESI-Q TRAP-MS/MS metabolite analysis of Cori.ST1911 and GAM broth control group serum (Veh., n = 5; Cori.ST1911, n = 5). B Differential metabolites VIP of Cori.ST1911 and GAM broth control group serum. Red dots represent upregulated differentially expressed metabolites; green dots represent downregulated differentially expressed metabolites. C Violin plot of changes in serum acylcarnitine content of the Cori.ST1911 and GAM broth control groups. D Schematic diagram of the experimental procedure to construct model cell lines co-cultured with Cori.ST1911. E Intracellular palmitoyl L-carnitine concentration of cells treated with vehicle (n = 3) or Cori.ST1911 (n = 3). Data are represented as mean ± SEM, analysed using two-tailed Student’s t-test. F Quantitative RT-PCR analysis of mRNA expression related to acylcarnitine in colonic tissue of mice treated with Cori.ST1911 or GAM broth (n = 5). Data are represented as mean ± SEM, analysed using one-way ANOVA. G Representative western blots showing the effect of Cori.ST1911 treatment in cell lines. Heat-killed (HK) Cori.ST1911 and E. coli were used as controls. Proteins were quantified densitometrically using ImageJ software and analysed using two-tailed Student’s t-test. VIP, variable important in projection; GAM, Gifu anaerobic medium; HK, heat-killed.
Fig. 5
Fig. 5. The CPT1A-MAPK pathway is involved in tumorigenesis caused by a high-fat diet.
A Percentage cell proliferation of CT26 cells treated with MEK inhibitor U0126-EtOH (25 µM), JNK inhibitor SP600125 (25 µM), P38/MAPK inhibitor SB20.2190 (20 µM), GSK3β inhibitor tws119 (20 µM), or AR-A014418 (20 µM), and vehicle or Cori.ST1911. Cell OD was measured using the CCK8 method and normalised to cell proliferation of the control. Inhibitor treatment started 4 h before Cori.ST1911 treatment. Data are represented as mean ± SEM (n = 3 independent tests), analysed by one-way analysis of variance (ANOVA) with Bonferroni’s post-hoc test. n.s., no significance. B Representative western blots showing the effect of increasing Cori.ST1911 MOI (100-300) on CPT1A and p-ERK. C Representative western blots showing the effect of Cori.ST1911 on CPT1A and MAPK-related genes after treatment with SiCPT1A (48 h) or etomoxir (100 µM). Proteins were quantified densitometrically using ImageJ software and analysed using two-tailed Student’s t-test (B, C). D Schematic diagram of the experimental procedure of HFD and HFD-LC (L-carnitine, 100 mg/kg/day) treatment of C57BL/6J AOM mice, and representative colon tumour images. E Tumour number, tumour volume, and serum palmitoyl L-carnitine concentration in HFD- and HFD-LC-fed C57BL/6J AOM mice (n = 6). Data are represented as mean ± SEM, analysed using two-tailed Student’s t-test. F Schematic diagram of the experimental procedure of HFD and HFD-metronidazole treatment of C57BL/6J AOM mice, and representative colon tumour images. G Tumour number, tumour volume, and serum palmitoyl L-carnitine concentration in HFD- and HFD-metronidazole-fed C57BL/6J AOM mice (n = 6). Data are represented as mean ± SEM, analysed using two-tailed Student’s t-test. H Schematic diagram of the experimental procedure of Cori.ST1911 and Cori.ST1911-etomoxir treatment of subcutaneous transplanted tumour BALB/c mice, and representative colon tumour images. BALB/c mice were randomly divided into groups after subcutaneous injection of CT26 cells, followed by intragastric administration of Cori.ST1911 (1 × 108 CFU once every 2 days) and intraperitoneal injection of etomoxir (15 mg/kg, 3 times/week). I Representative western blots showing MAPK-related protein expression in HFD-, HFD-LC-, and HFD-metronidazole-fed mice. Proteins were quantified densitometrically using ImageJ software and analysed using two-tailed Student’s t-test. MOI, multiplicity of infection; LC, L-carnitine; ERK, extracellular regulated protein kinases; MEK, Mitogen-activated protein kinase; MAPK, mitogen-activated protein kinase.
Fig. 6
Fig. 6. Lactobacillus murinus ameliorates tumour development induced by Cori.ST1911.
A Schematic diagram of the experimental procedure of C57BL/6J AOM mice gavaged with Cori.ST1911, and Cori.ST1911 combined with La.mu730 or La.jo181, and representative colon tumour images. After 1 week of antibiotic treatment, C57BL/6J AOM mice were gavaged with combined Cori.ST1911 and La.mu730 or La.jo181 (1 × 108 CFU of each strain) every 2 days. B Tumour number and volume of C57BL/6J AOM mice gavaged with Cori.ST1911 and Cori.ST1911 combined with La.mu730 or La.jo181 (n = 6). Data are represented as mean ± SEM, analysed using one-way ANOVA. C Serum FITC dextran concentration was measured 4 h after intragastric glycoside-binding fluorescein isothiocyanate administration from 6 to 20 weeks (n = 4). Data are represented as mean ± SEM, analysed using one-way ANOVA; n.s., no significance. D Representative images of IHC of tissue nuclear Ki67, TJ protein (ZO-1, Occludin), and mucin-related protein (MUC2, Alcian blue) of C57BL/6J AOM mice gavaged with Cori.ST1911 and Cori.ST1911 combined with La.mu730 or La.jo181. Scale bars: 200 µm. E Representative western blots showing CPT1A and MAPK-related protein expression in the Cori.ST1911 and Cori.ST1911 combined with La.mu730 groups. Proteins were quantified densitometrically using ImageJ software and analysed using two-tailed Student’s t-test. F Immunofluorescence staining of CPT1A and MUC2 in mouse intestinal organoids separated from WT mice and co-cultured with PLC (75 μM), Cori.ST1911, La.mu730, and Cori.ST1911 combined with La.mu730 (MOI = 100) for 24 h. TJ, tight junctions; PLC, palmitoyl L-carnitine; ERK, extracellular regulated protein kinases; MEK, mitogen-activated protein kinase; IHC, immunohistochemistry.

Similar articles

Cited by

References

    1. Keum N, Giovannucci E. Global burden of colorectal cancer: emerging trends, risk factors and prevention strategies. Nat. Rev. Gastroenterol. Hepatol. 2019;16:713–732. doi: 10.1038/s41575-019-0189-8. - DOI - PubMed
    1. GBD. et al. The global, regional, and national burden of colorectal cancer and its attributable risk factors in 195 countries and territories, 1990-2017: a systematic analysis for the Global Burden of Disease Study 2017. Lancet Gastroenterol. Hepatol. 2019;12:913–933. - PMC - PubMed
    1. Marchesi, et al. The gut microbiota and host health: a new clinical frontier. Gut. 2016;65:330–339. doi: 10.1136/gutjnl-2015-309990. - DOI - PMC - PubMed
    1. Wong SH, Yu J. Gut microbiota in colorectal cancer: mechanisms of action and clinical applications. Nat. Rev. Gastroenterol. Hepatol. 2019;16:690–704. doi: 10.1038/s41575-019-0209-8. - DOI - PubMed
    1. Tilg H, et al. The intestinal microbiota in colorectal cancer. Cancer Cell. 2018;33:954–964. doi: 10.1016/j.ccell.2018.03.004. - DOI - PubMed

Substances