. 2024 Jan 20;24(1):31.
doi: 10.1186/s12866-023-03148-6.

Modeling the limits of detection for antimicrobial resistance genes in agri-food samples: a comparative analysis of bioinformatics tools

Affiliations

Modeling the limits of detection for antimicrobial resistance genes in agri-food samples: a comparative analysis of bioinformatics tools

Ashley L Cooper et al. BMC Microbiol. .

Abstract

Background: Although the spread of antimicrobial resistance (AMR) through food and its production poses a significant concern, there is limited research on the prevalence of AMR bacteria in various agri-food products. Sequencing technologies are increasingly being used to track the spread of AMR genes (ARGs) in bacteria, and metagenomics has the potential to bypass some of the limitations of single isolate characterization by allowing simultaneous analysis of the agri-food product microbiome and associated resistome. However, metagenomics may still be hindered by methodological biases, presence of eukaryotic DNA, and difficulties in detecting low abundance targets within an attainable sequence coverage. The goal of this study was to assess whether limits of detection of ARGs in agri-food metagenomes were influenced by sample type and bioinformatic approaches.

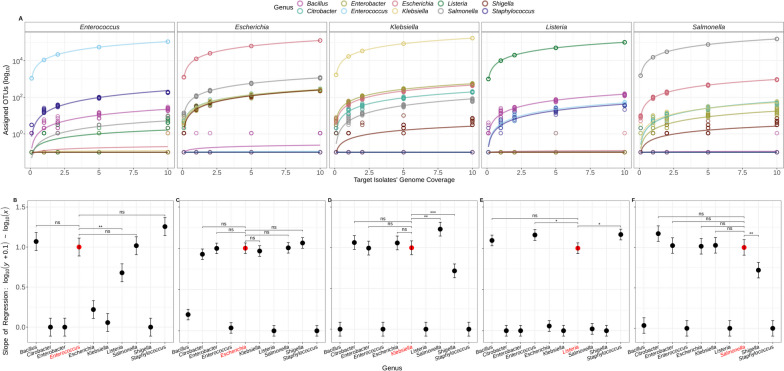
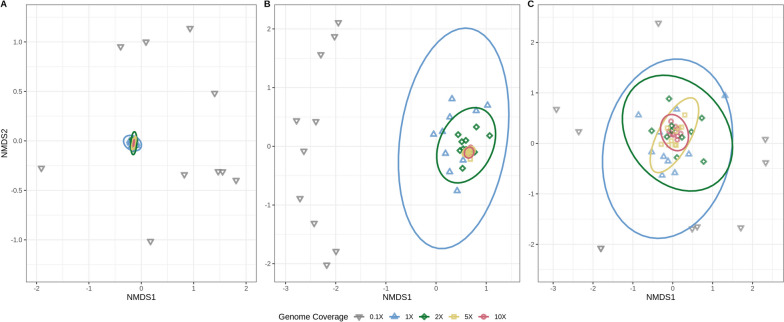
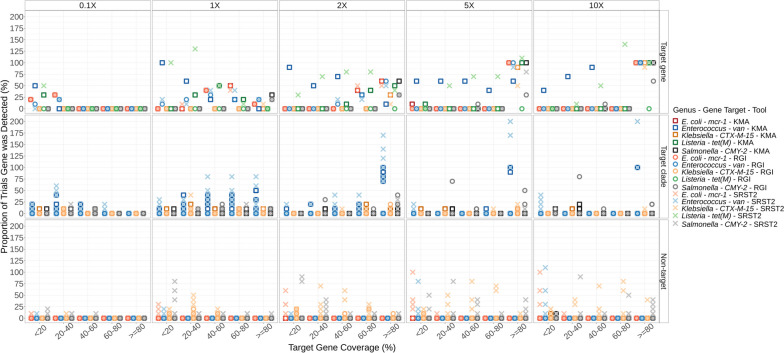
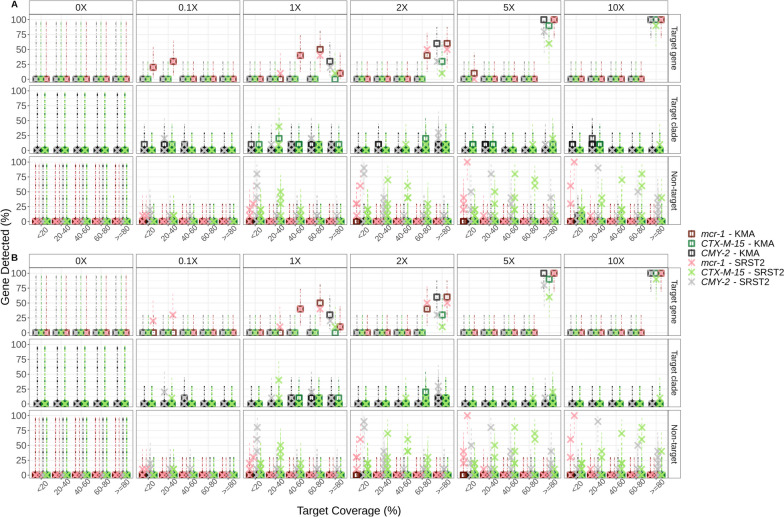
Results: We simulated metagenomes containing different proportions of AMR pathogens and analysed them for taxonomic composition and ARGs using several common bioinformatic tools. Kraken2/Bracken estimates of species abundance were closest to expected values. However, analysis by both Kraken2/Bracken indicated presence of organisms not included in the synthetic metagenomes. Metaphlan3/Metaphlan4 analysis of community composition was more specific but with lower sensitivity than the Kraken2/Bracken analysis. Accurate detection of ARGs dropped drastically below 5X isolate genome coverage. However, it was sometimes possible to detect ARGs and closely related alleles at lower coverage levels if using a lower ARG-target coverage cutoff (< 80%). While KMA and CARD-RGI only predicted presence of expected ARG-targets or closely related gene-alleles, SRST2 (which allows read to map to multiple targets) falsely reported presence of distantly related ARGs at all isolate genome coverage levels. The presence of background microbiota in metagenomes influenced the accuracy of ARG detection by KMA, resulting in mcr-1 detection at 0.1X isolate coverage in the lettuce but not in the beef metagenome.

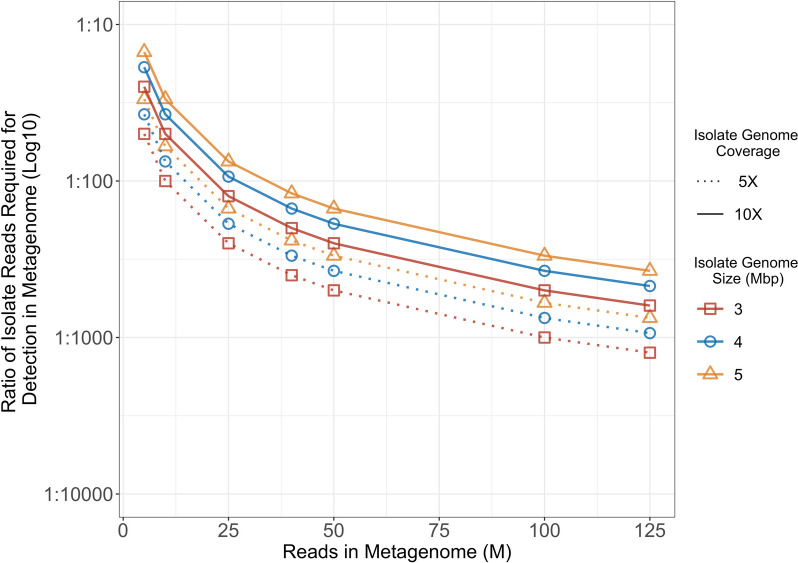
Conclusions: This study demonstrates accurate detection of ARGs in synthetic metagenomes using various bioinformatic methods, provided that reads from the ARG-encoding organism exceed approximately 5X isolate coverage (i.e. 0.4% of a 40 million read metagenome). While lowering thresholds for target gene detection improved sensitivity, this led to the identification of alternative ARG-alleles, potentially confounding the identification of critical ARGs in the resistome. Further advancements in sequencing technologies providing increased coverage depth or extended read lengths may improve ARG detection in agri-food metagenomic samples, enabling use of this approach for tracking clinically important ARGs in agri-food samples.

Keywords: Antimicrobial resistance; Limit of detection; Metagenomics; Sequence coverage.


Conflict of interest statement

Competing interests. ST (Sandeep Tamber) is a member of the BMC Microbiology Editorial board.We have no other competing interests. The authors declare that they have no other competing interests.

Figures

Fig. 1
Fig. 1
Incorrect assignment of operational taxonomic units (OTUs) to closely related genera. A Assigned OTUs (y-axis) as a function of target isolate’s genome coverage (x-axis). Analyses were conducted on subsampled reads of each target-genus (top-panel headings) and grouped by genus (color legend). For each coverage level (0.1, 1, 2, 5, or 10X) n = 10 subsampled replicates of the target organism were created. Lines represent the linear regression (log (y + 0.1) ~ log(x)) fit to each genus (see legend). B to F: Pairwise comparisons between top 10 genera with mapped OTUs and subsampled targets: B. Enterococcus, C. Escherichia, D. Klebsiella, E. Listeria, and F. Salmonella. Points represent the modelled slope of the regression analysis ± 95% confidence intervals (y-axis). Target organism is indicated by a red circle and red text (x-axis). Significance values are displayed above select data points of interest: p > 0.05 = ns; p < 0.05 = *; p < 0.01 = **; p < 0.001 = ***
Fig. 2
Fig. 2
Taxonomic assignment of control mixtures by different bioinformatics tools. A Abundance (y-axis) of each genus (see color legend) in synthetic-community mixtures. Data for expected values are plotted next to results (average of 10 replicates) from analyses by Bracken, Kraken2, Metaphlan3, and Metaphlan4 classifiers. B, C Distance between the abundance profile for each classifier compared to the expected composition (n = 10 replicates). B L2 abundance distances for each taxonomic classifier compared to the expected composition, assessed for each genus. Genera are differentiated by point shape. C L2 abundance distances for each taxonomic classifier compared to the expected composition, assessed for each synthetic-community mixture. Synthetic-community mixtures are differentiated by point-shape. D, E Principal coordinate analysis of all synthetic-metagenomic mixture replicates’ (n = 10) (D) calculated organism abundances and (E) assigned number of operational taxonomic units. Mixtures are differentiated by colour. Point shape denotes classification method. The percentage in parentheses on each axis gives the estimated contribution of each principal coordinate to the total variance
Fig. 3
Fig. 3
As sequence coverage increases detection of encoded AMR gene composition becomes more consistent and reliable. Non-metric multidimensional scaling (NMDS) of the number of reads mapped to AMR genes in subsampled sequence replicates for (A) Enterococcus, (B) Escherichia coli, and (C) Klebsiella isolates. Ordination was conducted using NMDS and Bray–Curtis dissimilarity. Subsampled genome coverage is differentiated by point shape and colour. n = 10 replicates for each of the five coverage levels (50 total per isolate). Ellipses represent 99% confidence regions. Ellipses for 0.1X genome coverage have been omitted
Fig. 4
Fig. 4
ARG detection in low complexity bacterial metagenomes. Synthetic metagenomes (n = 50) consisting of short-reads from five organisms mixed at different relative proportions (0.1-, 1-, 2-, 5-, and 10-X genome coverage; n = 10 at each coverage level) were evaluated for presence of ARGs using KMA (□), CARD-RGI (Ο), and SRST2 (✕) in silico tools. Percent ARG detection (y-axis) in 10 replicates as a function of target gene template coverage (x-axis) is shown. Point color differentiates between organism and ARG-detection tool used (see legend). Where multiple points of the same colour/shape are present for a given template-identity range (x-axis), each point represents a different allele. Detection greater than 100% indicates detection of multiple alleles, rather than only the target allele
Fig. 5
Fig. 5
Accurate ARG detection is dependent on isolate coverage in metagenome. Synthetic metagenomes containing A) lettuce soil metagenome and B) beef fecal metagenome mixed with synthetic-community mixed reads at 0.1-, 1-, 2-, 5-, and 10-X genome coverage (n = 10 at each coverage level) were evaluated for presence of ARGs using both KMA (□) and SRST2 (✕) in silico tools. Only results for CTX-M-15, CMY-2, and mcr-1 are displayed (see colour legend). Lettuce, soil and beef fecal metagenomes without added synthetic-community reads were analysed as a control (0X panel, n = 1). Percent ARG detection (y-axis) of 10 replicates, with upper and lower 95% confidence intervals (dashed lines), are plotted as a function of detected ARG template gene coverage (x-axis). Target gene panel (right y-axis label, top row), refers to the gene-allele detected in the original isolate assembly; Target clade (middle row), refers to detection of alleles within the same phylogenetic clade as the target gene (e.g. a CMY-allele closely related to CMY-2); Non-target (bottom row), refers to alleles of the target gene family that are not as closely related to the target gene (e.g. ≤ 90% nucleotide identity to CMY-2). Darker point-color intensity is a result of multiple points (different gene-alleles) overlapping. Where multiple points of the same shape/colour are present (e.g. B: Bottom right: 10X – Non-target Alleles—≥ 80% coverage there are five CMY-2 ✕s), each point represents a different allele (e.g. blaCMY-81, blaCMY-83, blaCMY-90, blaCMY-97, and blaCMY-114, were all detected by SRST2 and are each denoted by separate ✕ points)
Fig. 6
Fig. 6
The fewer the number of bacterial reads in a metagenome, the higher the proportion the target bacteria must constitute in order to accurately detect ARGs. The ratio of isolate reads required for ARG detection in a metagenome (log10 y-axis), grouped by isolates’ genome size, was plotted as a function of total reads in metagenome (x-axis, M = million). Estimates were conducted for a “best case scenario”, where all reads in the metagenome mapped to bacteria. Isolate genome sizes of 3, 4, and 5 Mbp (million base pairs) are differentiated by point shape and colour. For each genome size (colour), isolate genome coverage levels are differentiated by linetype: 5X coverage, dotted; 10X coverage, solid

Similar articles

References

    1. Berendonk TU, Manaia CM, Merlin C, Fatta-Kassinos D, Cytryn E, Walsh F, et al. Tackling antibiotic resistance: the environmental framework. Nat Rev Microbiol. 2015;13(5):310. doi: 10.1038/nrmicro3439. - DOI - PubMed
    1. Huijbers PMC, Blaak H, de Jong MCM, Graat EAM, Vandenbroucke-Grauls CMJE, de Roda Husman AM. Role of the environment in the transmission of antimicrobial resistance to humans: a review. Environ Sci Technol. 2015;49(20):11993–12004. doi: 10.1021/acs.est.5b02566. - DOI - PubMed
    1. Bengtsson-Palme J. Antibiotic resistance in the food supply chain: where can sequencing and metagenomics aid risk assessment? Curr Opin Food Sci. 2017;1(14):66–71. doi: 10.1016/j.cofs.2017.01.010. - DOI
    1. Founou LL, Founou RC, Essack SY. Antimicrobial resistance in the farm-to-plate continuum: more than a food safety issue. Future Sci OA. 2021;7(5):FSO692. doi: 10.2144/fsoa-2020-0189. - DOI - PMC - PubMed
    1. Hudson JA, Frewer LJ, Jones G, Brereton PA, Whittingham MJ, Stewart G. The agri-food chain and antimicrobial resistance: a review. Trends Food Sci Technol. 2017;1(69):131–147. doi: 10.1016/j.tifs.2017.09.007. - DOI

Publication types

Substances

LinkOut - more resources