. 2024 Jan 20;16(1):15.
doi: 10.1186/s13195-024-01384-0.

Histone deacetylase inhibitors VPA and WT161 ameliorate the pathological features and cognitive impairments of the APP/PS1 Alzheimer's disease mouse model by regulating the expression of APP secretases

Affiliations

Histone deacetylase inhibitors VPA and WT161 ameliorate the pathological features and cognitive impairments of the APP/PS1 Alzheimer's disease mouse model by regulating the expression of APP secretases

Miaomiao Zhang et al. Alzheimers Res Ther. .

Abstract

Background: Alzheimer's disease (AD) is a degenerative neurological disorder. Recent studies have indicated that histone deacetylases (HDACs) are among the most prominent epigenetic therapy targets and that HDAC inhibitors have therapeutic effects on AD. Here, we identified sodium valproate (VPA), a pan-HDAC inhibitor, and WT161, a novel HDAC6 selective inhibitor, as potential therapeutic agents for AD. Underlying molecular mechanisms were investigated.

Methods: A cellular model, N2a-APPswe, was established via lentiviral infection, and the APPswe/PSEN1dE9 transgenic mouse model was employed in the study. LC-MS/MS was applied to quantify the concentration of WT161 in the mouse brain. Western blotting, immunohistochemical staining, thioflavin-S staining and ELISA were applied to detect protein expression in cells, tissues, or serum. RNA interference was utilized to knockdown the expression of specific genes in cells. The cognitive function of mice was assessed via the nest-building test, novel object recognition test and Morris water maze test.

Results: Previous studies have focused mainly on the impact of HDAC inhibitors on histone deacetylase activity. Our study discovered that VPA and WT161 can downregulate the expression of multiple HDACs, such as HDAC1 and HDAC6, in both AD cell and mouse models. Moreover, they also affect the expression of APP and APP secretases (BACE1, PSEN1, ADAM10). RNA interference and subsequent vitamin C induction further confirmed that the expression of APP and APP secretases is indeed regulated by HDAC1 and HDAC6, with the JNK pathway being the intermediate link in this regulatory process. Through the above pathways, VPA and WT161 effectively reduced Aβ deposition in both AD cell and mouse models and significantly improved cognitive function in AD mice.

Conclusions: In general, we have discovered that the HDAC6-JNK-APP secretases cascade is an important pathway for VPA and WT161 to exert their therapeutic effects on AD. Investigations into the safety and efficacy of VPA and WT161 were also conducted, providing essential preclinical evidence for assessing these two epigenetic drugs for the treatment of AD.

Keywords: Alzheimer’s disease; Aβ deposition; Cognitive function; Histone deacetylase; VPA; WT161.


Conflict of interest statement

The authors declare no competing interests.

Figures

Fig. 1
Fig. 1
Effect of VPA and WT161 on the expression of HDAC1 and HDAC6 in N2a-APPswe. A Western blot detection of HDAC1 and HDAC6 expression in N2a-APPswe treated with different concentration gradients of VPA for 72 h. D Western blot detection of HDAC1 and HDAC6 expression in N2a-APPswe treated with different concentrations of WT161 for 72 h. B, C, E, F The results of greyscale scan analysis (x¯±s, n = 3), in which N2a-APPswe treated with 0 μM VPA and WT161 were used as the baseline for one-way ANOVA to compare the differences with other treatment groups, *P < 0.05 and **P < 0.01
Fig. 2
Fig. 2
Effect of VPA and WT161 on APP metabolism-related protein expression in N2a-APPswe cells. A Western blot detection of APP, ADAM10, BACE1 and PS-1 expression in N2a-APPswe treated with different concentrations of VPA for 72 h. G Western blot detection of APP, ADAM10, BACE1 and PS-1 expression in N2a-APPswe treated with different concentrations of WT161 for 72 h. BE, HK The results of grayscale scan analysis (x¯±s, n = 3), in which N2a-APPswe treated with VPA and WT161 in group 0 were used as the baseline, using one-way ANOVA to compare the differences with other treatment groups, *P < 0.05, **P < 0.01. FL The soluble Aβ42 protein concentrations (detected by ELISA) in N2a-APPswe treated with different concentration gradients of VPA versus WT161 for 72 h (x¯±s, n = 3), in which group 0 was used as the baseline, using one-way ANOVA to compare the differences with other treatment groups, *P < 0.05, ** P < 0.01
Fig. 3
Fig. 3
Effect of HDACs knockdown on APP metabolism-related protein expression in N2a-APPswe. a Western blot detection of HDAC1, APP, ADAM10, BACE1 and PS-1 expression in N2a, N2a-APPswe and N2a-APPswe-shHDAC1 cells. bf The results of grayscale scan analysis (x¯±s, n = 3), in which N2a-APPswe were treated with one-way ANOVA to compare the differences with other treatment groups, *P < 0.05, **P < 0.01. g Soluble Aβ42 protein concentrations in N2a, N2a-APPswe and N2a-APPswe-shHDAC1 (x¯±s, n = 3). h Western blot detection of HDAC6, APP, ADAM10, BACE1 and PS-1 expression in N2a, N2a-APPswe and N2a-APPswe-shHDAC6 cells. in The results of grayscale scan analysis (x¯±s, n = 3), in which N2a-APPswe was treated as the baseline, and one-way ANOVA was used to compare the differences with other treatment groups, *P < 0.05, **P < 0.01. g N2a, N2a-APPswe and N2a-APPswe-shHDAC6 cell soluble Aβ42 protein concentrations (x¯±s, n = 3)
Fig. 4
Fig. 4
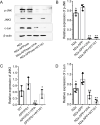
Effect of VPA and WT161 on the JNK/c-Jun pathway in N2a-APPswe. A Western blot detection of p-JNK, JNK3 and c-Jun expression in N2a-APPswe cells after VPA (2.5 mM) and WT161 (10 μM) treatment for 72 h. BD The results of greyscale scan analysis (x¯±s, n = 3), in which the N2a-APPswe cell group was used as the baseline and compared with other treatment groups using one-way ANOVA, *P < 0.05 and **P < 0.01
Fig. 5
Fig. 5
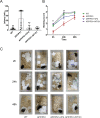
Nest-building test detects the effect on social activity and daily behavioural ability. A The differences between the APP/PS1 group and the other treatment groups in social activity and daily behavioural ability were compared using one-way ANOVA during the nesting latency period (x¯±s, n = 8). B Nesting scores of mice in each group at 2, 24 and 48 h after the start of nesting, using two-way repeated-measures ANOVA to compare the effects of different treatments and times on nesting scores of mice. C Schematic diagram of nesting in each group at 24 h and 48 h after the start of nesting. *P < 0.05, **P < 0.01
Fig. 6
Fig. 6
New object recognition test detecting the effect on short-term learning memory behaviour. A The number of times mice explored new objects, using the APP/PS1 group as the baseline, and one-way ANOVA was used to compare the differences with other treatment groups on short-term learning memory behaviour (x¯±s, n = 6). B The discrimination index of mice in each group, using the APP/PS1 group as the baseline and comparing with other treatment groups using one-way ANOVA. C Trajectory pattern plots of each group of mice exploring old and new things, a: old things, c: new things. *P < 0.05 and ** P < 0.01
Fig. 7
Fig. 7
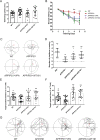
Morris water maze test detecting the effects on spatial localization and long-term memory ability. A Mouse swimming speed, using the APP/PS1 group as the baseline and comparing the differences with other treatment groups using one-way ANOVA (x¯±s, n = 18). b The evasion latency of each group in the localization navigation experiment and the effect of different treatments and times on the evasion latency of mice were compared using two-way repeated-measures ANOVA. C Schematic diagram of the original swimming trajectory of each group of mice on the fifth day of the positioning navigation experiment. DF denote the number of times mice crossed the original platform, the distance/total distance of the original platform quadrant and the time/total time of the original platform quadrant for each group of the spatial exploration experiment, using the APP/PS1 group as the baseline and comparing the differences with other treatment groups using one-way ANOVA. G Schematic diagram of the original swimming trajectory of each group of mice in the spatial exploration experiment. *P < 0.05, **P < 0.01
Fig. 8
Fig. 8
Effects of VPA and WT161 on HDACs and the JNK/c-Jun pathway. A Western blot detection of HDAC1 and HDAC6 expression in the mouse cortex in each group. D Western blot detection of HDAC1 and HDAC6 expression in the mouse hippocampus in each group. B, C, E, F The results of grayscale scan analysis (x¯±s, n = 3), in which the APP/PS1 group was used as the baseline, and one-way ANOVA was used to compare the differences with other treatment groups, *P < 0.05, **P < 0.01. G Western blot to detect the effect of VPA and WT161 treatment on the expression of p-JNK, JNK3 and c-Jun in the cerebral cortex of APP/PS1 double transgenic AD mice. HJ The results of grayscale scan analysis (x¯±s, n = 3), in which the APP/PS1 group was the baseline and compared with other treatment groups using one-way ANOVA (*P < 0.05 and **P < 0.01)
Fig. 9
Fig. 9
Effects of VPA and WT161 treatment on APP metabolism-related protein expression. A Western blot detection of APP, ADAM10, BACE1 and PS-1 expression in the cerebral cortex of each group of mice. F Western blot detection of APP, ADAM10, BACE1 and PS-1 expression in the hippocampus of each group of mice. BE, GL The results of grayscale scan analysis (x¯±s, n = 3), in which the APP/PS1 group was the baseline, and compared with other treatment groups using one-way ANOVA, *P < 0.05, **P < 0.01
Fig. 10
Fig. 10
Detection of brain Aβ amyloid deposition in VPA- and WT161-treated AD mice by thioflavin-S. A Thioflavin-S staining (× 200, coronal cut) to detect Aβ amyloid deposition in the cortex and hippocampus of each group of mice. B, C The area ratio of Aβ amyloid plaques in the cortex and hippocampus of each group of mice (x¯± s, n = 6). D, E The number of Aβ amyloid plaques in the cortex and hippocampus of each group (x¯± s, n = 6), all of the above were based on the APP/PS1 group, in which the APP/PS1 group was the baseline, and compared with other treatment groups using one-way ANOVA, *P < 0.05, **P < 0.01

Similar articles

Cited by

References

    1. Wamsley B, Geschwind DH. Functional genomics links genetic origins to pathophysiology in neurodegenerative and neuropsychiatric disease. Curr Opin Genet Dev. 2020;65:117–125. doi: 10.1016/j.gde.2020.05.032. - DOI - PMC - PubMed
    1. Hou Y, Dan X, Babbar M, Wei Y, Hasselbalch SG, Croteau DL, et al. Ageing as a risk factor for neurodegenerative disease. Nat Rev Neurol. 2019;15(10):565–581. doi: 10.1038/s41582-019-0244-7. - DOI - PubMed
    1. Haass C, Kaether C, Thinakaran G, Sisodia S. Trafficking and proteolytic processing of APP. Cold Spring Harb Perspect Med. 2012;2(5):a006270. doi: 10.1101/cshperspect.a006270. - DOI - PMC - PubMed
    1. Hampel H, Vassar R, De Strooper B, Hardy J, Willem M, Singh N, et al. The beta-secretase BACE1 in Alzheimer’s disease. Biol Psychiatry. 2021;89(8):745–756. doi: 10.1016/j.biopsych.2020.02.001. - DOI - PMC - PubMed
    1. LaFerla FM, Green KN, Oddo S. Intracellular amyloid-beta in Alzheimer’s disease. Nat Rev Neurosci. 2007;8(7):499–509. doi: 10.1038/nrn2168. - DOI - PubMed

Publication types

MeSH terms