. 2024 Jan 20;19(1):7.
doi: 10.1186/s13024-023-00699-0.

Unravelling cell type-specific responses to Parkinson's Disease at single cell resolution

Affiliations

Unravelling cell type-specific responses to Parkinson's Disease at single cell resolution

Araks Martirosyan et al. Mol Neurodegener. .

Erratum in

Abstract

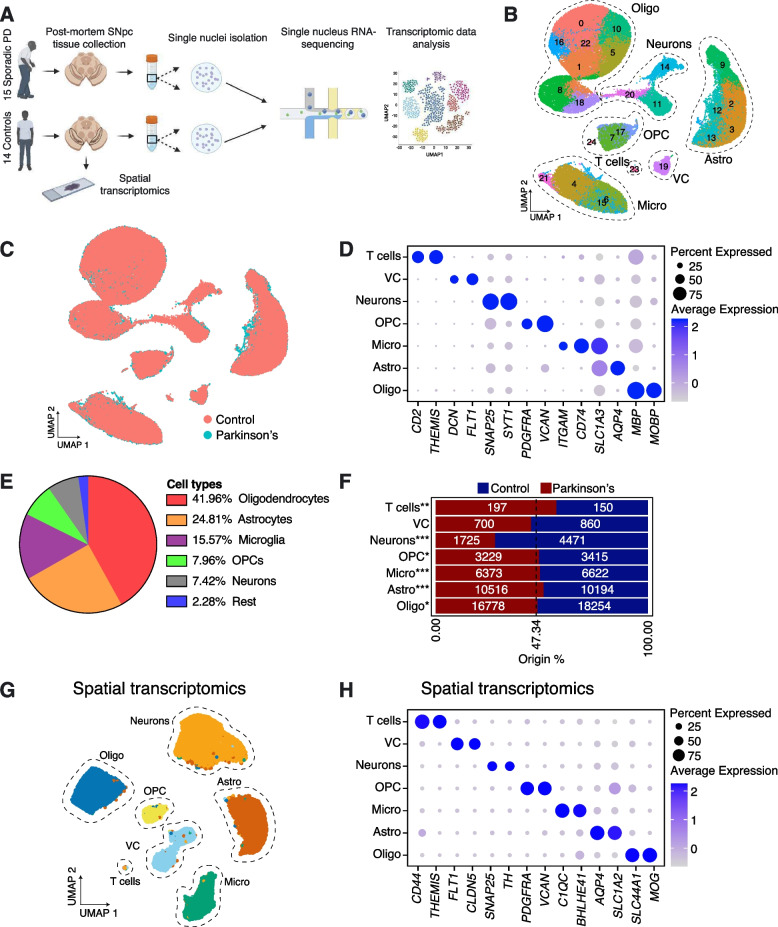
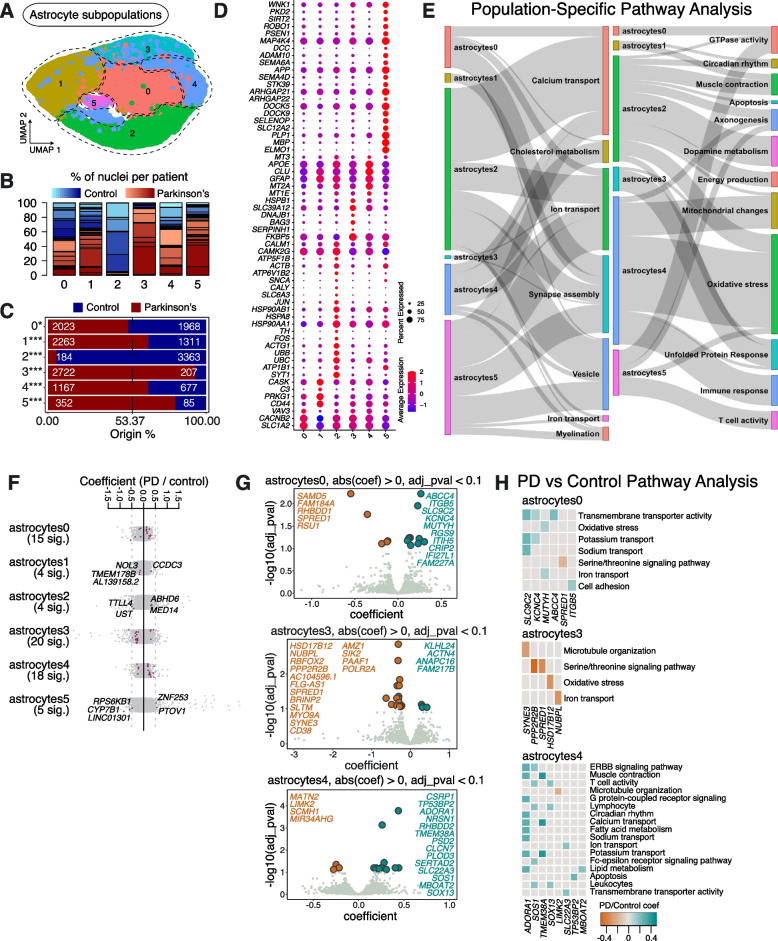
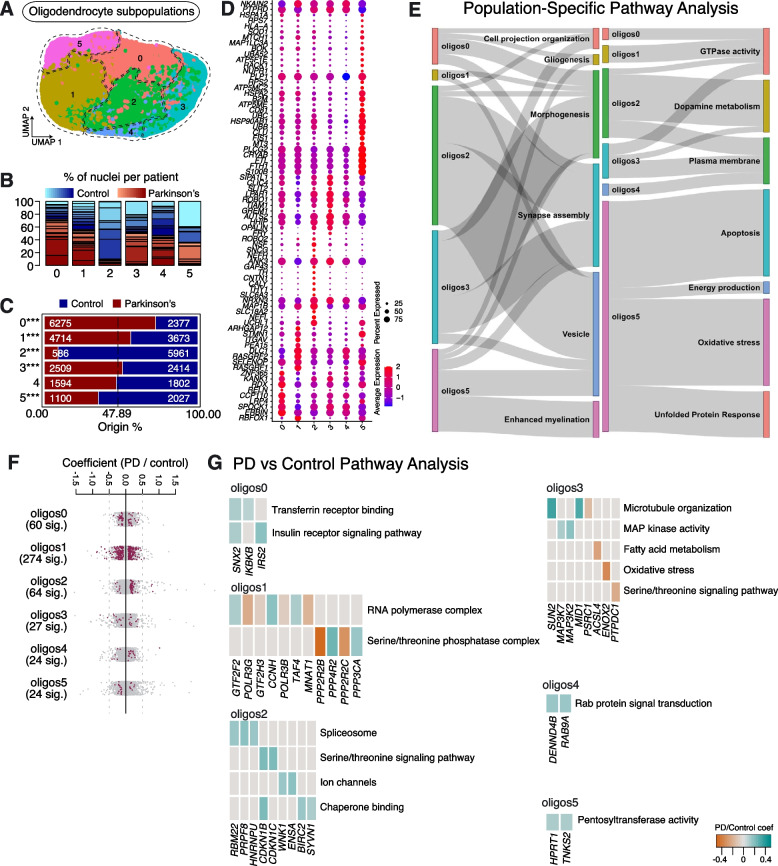
Parkinson's Disease (PD) is the second most common neurodegenerative disorder. The pathological hallmark of PD is loss of dopaminergic neurons and the presence of aggregated α-synuclein, primarily in the substantia nigra pars compacta (SNpc) of the midbrain. However, the molecular mechanisms that underlie the pathology in different cell types is not currently understood. Here, we present a single nucleus transcriptome analysis of human post-mortem SNpc obtained from 15 sporadic Parkinson's Disease (PD) cases and 14 Controls. Our dataset comprises ∼84K nuclei, representing all major cell types of the brain, allowing us to obtain a transcriptome-level characterization of these cell types. Importantly, we identify multiple subpopulations for each cell type and describe specific gene sets that provide insights into the differing roles of these subpopulations. Our findings reveal a significant decrease in neuronal cells in PD samples, accompanied by an increase in glial cells and T cells. Subpopulation analyses demonstrate a significant depletion of tyrosine hydroxylase (TH) enriched astrocyte, microglia and oligodendrocyte populations in PD samples, as well as TH enriched neurons, which are also depleted. Moreover, marker gene analysis of the depleted subpopulations identified 28 overlapping genes, including those associated with dopamine metabolism (e.g., ALDH1A1, SLC6A3 & SLC18A2). Overall, our study provides a valuable resource for understanding the molecular mechanisms involved in dopaminergic neuron degeneration and glial responses in PD, highlighting the existence of novel subpopulations and cell type-specific gene sets.


Conflict of interest statement

T.G.B. is CEO of The Bioinformatics CRO and Senior Director of Bioinformatics at Bit.Bio. D.R.T. has received various honoraria related to speaking engagements from Biogen (USA) and UCB (Brussels, Belgium), and benefited from research collaborations with Novartis Pharma AG (Basel, Switzerland), Probiodrug (Halle (Saale), Germany), GE Healthcare (Amersham, UK), and Janssen Pharmaceuticals (Beerse, Belgium). ​E.M. is an employee and shareholder of Bit.Bio. M.G.H. acted as a paid consultant to Resolve Biosciences during development of their Molecular Cartography system. A.M. is currently an employee at Muna Therapeutics.

Figures

Fig. 1
Fig. 1
Cell types in human substantia nigra parscompacta and their susceptibility to PD. A Schematic of the experimental design. Nuclei were isolated from sections of frozen post-mortem brain containing substantia nigra pars compacta (SNpc) from Control (14) and PD (15) donors. Sequencing libraries were then prepared using the 10X Genomics Chromium platform and sent for standard Illumina sequencing. Spatial transcriptomics was performed on slices of fresh frozen SNpc tissue; samples were taken from 3 Control donors and 3 sporadic PD patients, selected from the cohort of 29 brains used for sequencing (Supplementary Table 1). B UMAP-based clustering of 83,484 high quality nuclei obtained from 15 PD and 14 Control samples. Clusters representing neurons, oligodendrocytes (Oligo), astrocytes (Astro), microglia (Micro), oligodendrocyte progenitor cells (OPC), T cells and vascular cells (VC) were identified, based on the expression of known marker genes (see also Supplementary Fig. 1A). C UMAP showing how nuclei from PD and Control samples distribute across the different clusters. D Expression of cell markers used to identify higher level cell types in SNpc. E A pie chart showing the percentage of major cell types in our SNpc dataset. F Bar plots showing the relative number of nuclei per cluster originating from Control or PD samples against their predicted abundance (based on 47.34% of all nuclei originating from PD samples: dashed line). A Binomial test was performed to see if there is any significant divergence of cell proportions from this value, * p-value < 0.05, ** p-value < 0.0005, *** p-value < 0.00005. G Independent clustering of the spatial transcriptomics dataset. H Confirmation of cell type marker expression using spatial transcriptomics
Fig. 2
Fig. 2
Neuronal subpopulations found in human substantia nigra pars compacta and their response to PD. A Re-clustering of neurons identified in Fig. 1B. B Proportion of nuclei coming from Control (blue) or PD (red) donors per neuronal type reported in Fig. 2A. Different shades of blue and red represent different donors. C A comparison of nuclei number (expressed as a percentage) deriving from PD or Control brains against their predicted abundance (based on 27.96% of all nuclei originating from PD samples: dashed line). A Binomial test was performed to see if there is any significant divergence of cell proportions from this value, * p-value < 0.05, ** p-value < 0.0005, *** p-value < 0.00005. D Selected marker genes for neuronal populations reported in Fig. 2A. The full list of marker genes is reported in Supplementary Table 5. E A summary of pathway over-representation analysis using the marker genes defining neuronal populations 0–5. Two Sankey diagrams are shown which illustrate the relationships between the various neuronal subpopulations and relevant cellular pathways identified (listed in Supplementary Table 6 in the column labeled "Group"). The thickness of the grey interconnecting lines is proportional to the number of individual pathways falling within a particular functional group that is significantly over-represented among the markers of a given cellular subpopulation, normalized to the number of pathways displayed per Sankey plot. F A stripe chart reporting the number of significantly up- or downregulated genes in nuclei originating from PD donors (compared to Controls) per neuronal subpopulation, found by fitting a linear mixed model. Red dots correspond to genes that are up- (coefficient > 0) or downregulated (coefficient < 0), with an adjusted p-value < 0.1 (ANOVA test with Benjamini–Hochberg correction). The full list of the up- and downregulated genes is reported in Supplementary Table 7. G A volcano plot reporting genes up- (cyan) or downregulated (orange) in nuclei originating from PD donors (compared to Controls) and assigned to subpopulation Neurons0. H Pathways over-represented by up- or downregulated genes in nuclei originating from PD donors (compared to Controls) and assigned to subpopulation Neurons0, as reported in Supplementary Table 8
Fig. 3
Fig. 3
Astrocyte subpopulations found in human substantia nigra pars compacta and their response to PD. A Re-clustering of astrocytes identified in Fig. 1B. B Proportion of nuclei coming from Control (blue) or PD (red) patients per subpopulation reported in Fig. 3A. Different shades of blue and red represent different donors. C A comparison of nuclei number (expressed as a percentage) deriving from PD or Control brains against their predicted abundance (based on 53.37% of all nuclei originating from PD samples: dashed line). A Binomial test was performed to see if there is any significant divergence of cell proportions from this value, * p-value < 0.05, ** p-value < 0.0005, *** p-value < 0.00005. D Selected marker genes for astrocyte subpopulations reported in Fig. 3A. The full list of marker genes is reported in Supplementary Table 5. E A summary of pathway over-representation analysis using the marker genes defining astrocyte populations 0–5. Two Sankey diagrams are shown which illustrate the relationships between the various astrocyte subpopulations and relevant cellular pathways identified (listed in Supplementary Table 6 in the column labeled “Group”). The thickness of the grey interconnecting lines is proportional to the number of individual pathways falling within a particular functional group that is significantly over-represented among the markers of a given cellular subpopulation, normalized to the number of pathways displayed per Sankey plot. F A stripe chart reporting the number of significantly up- or downregulated genes in nuclei originating from PD donors (compared to Controls) per astrocyte subpopulation, found by fitting a linear mixed model. Red dots correspond to genes that are up- (coefficient > 0) or downregulated (coefficient < 0), with an adjusted p-value < 0.1 (ANOVA test with Benjamini–Hochberg correction). The full list of genes up- and downregulated in the various astrocyte subpopulations isolated from PD patients is reported in Supplementary Table 7. G A volcano plot reporting genes up- (cyan) or downregulated (orange) in nuclei originating from PD donors (compared to Controls): the astrocyte populations showing the most significant responses (Astrocytes0, Astrocytes3 and Astrocytes4) are shown. H Pathways over-represented by up- or downregulated genes in nuclei originating from PD patients (compared to Controls) and assigned to subpopulations Astrocytes0, Astrocytes3 and Astrocytes4, as reported in Supplementary Table 8
Fig. 4
Fig. 4
Microglia subpopulations found in human substantia nigra pars compacta and their response to PD. A Re-clustering of microglia identified in Fig. 1B. B Proportion of nuclei coming from Control (blue) and PD (red) patients per subpopulation reported in Fig. 4A. Different shades of blue and red represent different donors. C A comparison of nuclei number (expressed as a percentage) deriving from PD or Control brains against their predicted abundance (based on 50.19% of all nuclei originating from PD samples: dashed line). A Binomial test was performed to see if there is any significant divergence of cell proportions from this value, * p-value < 0.05, ** p-value < 0.0005, *** p-value < 0.00005. D Selected marker genes for microglial populations shown in Fig. 4A. The full list of marker genes is reported in Supplementary Table 5. E A summary of pathway over-representation analysis using the marker genes defining microglia populations 0–5. Two Sankey diagrams are shown which illustrate the relationships between the various microglia subpopulations and relevant cellular pathways identified (listed in Supplementary Table 6 in the column labeled “Group”). The thickness of the grey interconnecting lines is proportional to the number of individual pathways falling within a particular functional group that is significantly over-represented among the markers of a given cellular subpopulation, normalized to the number of pathways displayed per Sankey plot. F A stripe chart reporting the number of significantly up- or downregulated genes in nuclei originating from PD donors (compared to Controls) per microglial subpopulation, found by fitting a linear mixed model. Red dots correspond to genes that are up- (coefficient > 0) or downregulated (coefficient < 0), with an adjusted p-value < 0.1 (ANOVA test with Benjamini–Hochberg correction). The full list of genes up- or downregulated in the various microglia subpopulations isolated from PD patients is reported in Supplementary Table 7. G Volcano plots reporting genes up- (cyan) or downregulated (orange) in nuclei originating from PD donors (compared to Controls): two microglia populations (Microglia1 and Microglia3) are shown. H Pathways over-represented by up- or downregulated genes in nuclei from PD patients (compared to Controls) and assigned to subpopulations Microglia1 and Microglia3, as reported in Supplementary Table 8
Fig. 5
Fig. 5
Oligodendrocyte subpopulations found in human substantia nigra pars compacta and their response to PD. A Re-clustering of oligodendrocytes identified in Fig. 1B. B Proportion of nuclei coming from Control (blue) and PD (red) patients per subpopulation reported in Fig. 5A. Different shades of blue and red represent different donors. C A comparison of nuclei number (expressed as a percentage) deriving from PD or Control brains against their predicted abundance (based on 47.89% of all nuclei originating from PD samples: dashed line). A Binomial test was performed to see if there is any significant divergence of cell proportions from this value, * p-value < 0.05, ** p-value < 0.0005, *** p-value < 0.00005. D Selected marker genes for oligodendrocyte subpopulations shown in Fig. 5A. The full list of marker genes is reported in Supplementary Table 5. E A summary of pathway over-representation analysis using the marker genes defining oligodendrocyte populations 0–5. Two Sankey diagrams are shown which illustrate the relationships between the various oligodendrocyte subpopulations and relevant cellular pathways identified (listed in Supplementary Table 6 in the column labeled “Group”). The thickness of the grey interconnecting lines is proportional to the number of individual pathways falling within a particular functional group that is significantly over-represented among the markers of a given cellular subpopulation, normalized to the number of pathways displayed per Sankey plot. F A stripe chart reporting the number of significantly up- or downregulated genes in nuclei originating from PD donors (compared to Controls) per oligodendrocyte subpopulation, found by fitting a linear mixed model. Red dots correspond to genes that are up- (coefficient > 0) or downregulated (coefficient < 0), with an adjusted p-value < 0.1 (ANOVA test with Benjamini–Hochberg correction). The full list of genes up- or downregulated in the various oligodendrocyte subpopulations isolated from PD patients is reported in Supplementary Table 7. G Pathways over-represented by up- or downregulated genes in nuclei originating from PD donors (compared to Controls) and assigned to the oligodendrocyte subpopulations, as reported in Supplementary Table 8
Fig. 6
Fig. 6
PD-associated genes and genes near PD-associated variants show cell type-specific expression patterns. A Cell type enriched expression of high-confidence genes associated with monogenic PD. Ln-fold change of SCT-normalized counts is shown (Wilcoxon test, *FDR-corrected p-value < 0.05; see Supplementary Table 5). B-F Pseudo-Manhattan plots of the genes near PD-associated variants generated by MAGMA on the GWAS dataset curated by Nalls and colleagues [32]. The top differentially expressed genes per population/subpopulation which show significant association with PD variants (MAGMA p-value lower than 0.001, ln-fold change > 0.3 for population-level analysis, and ln-fold change > 0.25 for subpopulation-level analysis) are shown; VC, vascular cells; OPC, oligodendrocyte progenitor cells; Micro, microglia; Astro, astrocytes; Oligo, oligodendrocytes. G The number of cell type enriched marker genes that are also near PD-associated variants. The results of two-sided Binomial tests are shown at the top (ns = non-significant). The dashed line shows the expected number of markers given the null hypothesis (see ‘Methods’ and Supplementary Table 9)
Fig. 7
Fig. 7
Molecular similarities between tyrosine hydroxylase (TH) enriched cell types depleted in the substantia nigra pars compacta of PD patients. A TH expression comparison between dopaminergic Neurons0 and TH enriched glial cell types (Astrocytes2, Microglia1 and Oligos2). Higher level cell markers were used to confirm the identity of these subpopulations. B Venn diagram showing overlap of cell markers defining dopaminergic Neurons0 and TH enriched glial cell types. C Gene expression levels of cell markers shared between dopaminergic Neurons0 and TH enriched glial cell types. D GO term pathway analysis on the shared cell markers. E Representative images from spatial transcriptomics experiments showing the presence of SNAP25, SLC6A3 and TH transcripts (dots) in higher-order cell types (represented as polygons). Astro, astrocytes; VC, vascular cells; Micro, microglia; Oligo, oligodendrocytes; OPC, oligodendrocyte progenitor cells. Scale bar, 50 µm. F Gene expression levels for shared cell markers of higher-order cell types determined by spatial transcriptomics. Violin plots of SCT-normalized data are shown

References

    1. Bloem BR, Okun MS, Klein C. Parkinson’s disease. Lancet. 2021;397:2284–2303. doi: 10.1016/s0140-6736(21)00218-x. - DOI - PubMed
    1. Spillantini MG, Schmidt ML, Lee VM, Trojanowski JQ, Jakes R, Goedert M. Alpha-synuclein in Lewy bodies. Nature. 1997;388:839–840. doi: 10.1038/42166. - DOI - PubMed
    1. Ma SX, Lim SB. Single-cell RNA sequencing in Parkinson’s disease. Biomedicines. 2021;9(4):368. doi: 10.3390/biomedicines9040368. - DOI - PMC - PubMed
    1. Lang C, Campbell KR, Ryan BJ, Carling P, Attar M, Vowles J, et al. Single-cell sequencing of iPSC-Dopamine neurons reconstructs disease progression and identifies HDAC4 as a regulator of Parkinson cell phenotypes. Cell Stem Cell. 2019;24:93–106.e6. doi: 10.1016/j.stem.2018.10.023. - DOI - PMC - PubMed
    1. Fernandes HJR, Patikas N, Foskolou S, Field SF, Park JE, Byrne ML, et al. Single-cell transcriptomics of Parkinson’s disease human in vitro models reveals dopamine neuron-specific stress responses. Cell Rep. 2020;33(2):108263. 10.1016/j.celrep.2020.108263. - PubMed

Publication types

MeSH terms