. 2024 Mar 13;115(2):212-220.
doi: 10.1093/jhered/esae003.

A chromosome-level genome assembly for the dugong (Dugong dugon)

Affiliations

A chromosome-level genome assembly for the dugong (Dugong dugon)

Dorothy Nevé Baker et al. J Hered. .

Abstract

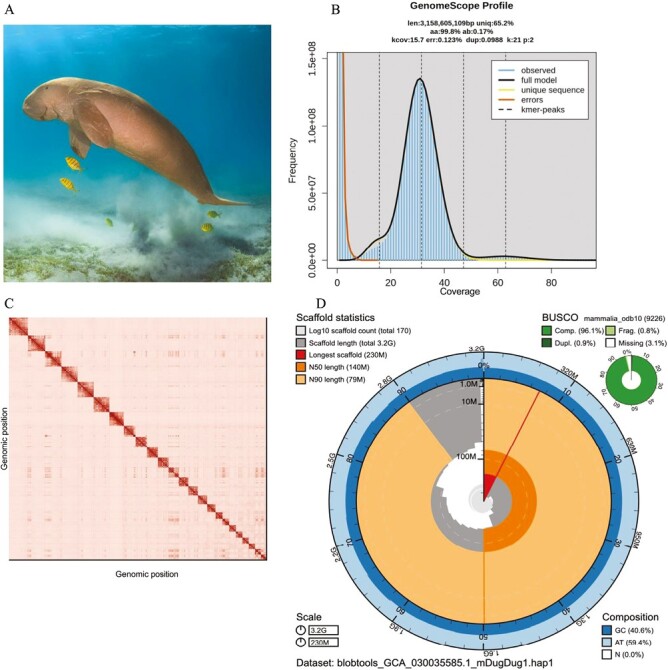
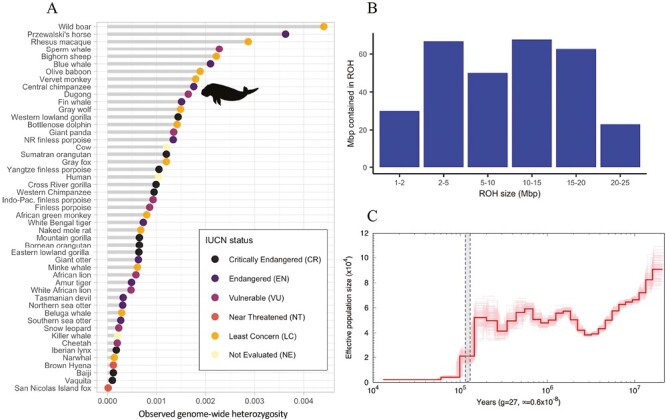
The dugong (Dugong dugon) is a marine mammal widely distributed throughout the Indo-Pacific and the Red Sea, with a Vulnerable conservation status, and little is known about many of the more peripheral populations, some of which are thought to be close to extinction. We present a de novo high-quality genome assembly for the dugong from an individual belonging to the well-monitored Moreton Bay population in Queensland, Australia. Our assembly uses long-read PacBio HiFi sequencing and Omni-C data following the Vertebrate Genome Project pipeline to reach chromosome-level contiguity (24 chromosome-level scaffolds; 3.16 Gbp) and high completeness (97.9% complete BUSCOs). We observed relatively high genome-wide heterozygosity, which likely reflects historical population abundance before the last interglacial period, approximately 125,000 yr ago. Demographic inference suggests that dugong populations began declining as sea levels fell after the last interglacial period, likely a result of population fragmentation and habitat loss due to the exposure of seagrass meadows. We find no evidence for ongoing recent inbreeding in this individual. However, runs of homozygosity indicate some past inbreeding. Our draft genome assembly will enable range-wide assessments of genetic diversity and adaptation, facilitate effective management of dugong populations, and allow comparative genomics analyses including with other sirenians, the oldest marine mammal lineage.

Keywords: Vertebrate Genomes Project; conservation; long-read assembly; marine mammals; sirenians; whole genome.


Figures

Fig. 1.
Fig. 1.
Dugong high-quality reference assembly. A) An adult dugong. Margarita Granovskaya via stock.adobe.com B) K-mer spectrum output generated from adapter-filtered PacBio HiFi data using GenomeScope 2.0. The bimodal pattern observed corresponds to a diploid genome. K-mers covered at lower coverage and lower frequency correspond to differences between haplotypes, and the higher coverage and higher frequency k-mers correspond to the similarities between haplotypes. C) Omni-C Contact maps for the curated genome assembly of haplotype 1 generated with PretextSnapshot. Omni-C contact maps translate proximity of genomic regions in 3D space to contiguous linear organization. Each cell in the contact map corresponds to sequencing data supporting the linkage (or join) between two of such regions. Scaffolds are separated by black lines. D) BlobToolKit Snail plot showing a graphical (continued next page) representation of the quality metrics presented in Table 2 for the Dugong dugon assembly for haplotype 1 (mDugdug1.hap1). The plot circle represents the full size of the assembly. From the inside out, the central plot covers length-related metrics. The red line represents the size of the longest scaffold; all other scaffolds are arranged in size order moving clockwise around the plot and drawn in gray starting from the outside of the central plot. Dark and light orange arcs show the scaffold N50 and scaffold N90 values. The central light gray spiral shows the cumulative scaffold count with a white line at each order of magnitude. White regions in this area reflect the proportion of Ns in the assembly. The dark versus light blue area around it shows mean, maximum, and minimum GC versus AT content at 0.1% intervals. The legend in the lower left indicates the scale of the circumference (3.2G total assembly size) and radius (230M longest scaffold) of the main plot. A summary of complete, fragmented, duplicated, and missing BUSCO genes in the mammalia_odb10 set is shown in the top right (Challis et al. 2020).
Fig. 2.
Fig. 2.
Diversity and demographic history of the dugong. A) Comparison of genome-wide heterozygosity in dugongs and other mammals drawn from the literature, based on Robinson et al. (2016). Dots are colored by the endangered status according to the International Union for Conservation of Nature (IUCN) Red List for Threatened Species. B) Count of runs of homozygosity (ROH) ≥1 Mbp across the dugong autosomal chromosomes of this study, binned by size. C) Effective population size over time, inferred with PSMC and scaled to the dugong generation time and mutation rate. Lighter lines represent bootstrap replicates. Vertical dashed bar represents the last interglacial period from approximately 130 to 115 ka.

References

    1. Bertram GCL, Bertram CKR.. The modern Sirenia: their distribution and status. Biol J Linn Soc. 1973:5:297–338.
    1. Best RC. Foods and feeding habits of wild and captive Sirenia. Mammal Rev. 1981:11:3–29.
    1. Blair D, McMahon A, Mcdonald B, Tikel D, Waycott M, Marsh H.. Pleistocene sea level fluctuations and the phylogeography of the dugong in Australian waters. Mar Mamm Sci. 2014:30:104–121.
    1. Camacho C, Coulouris G, Avagyan V, Ma N, Papadopoulos J, Bealer K, Madden TL.. BLAST+: architecture and applications. BMC Bioinf. 2009:10:421. - PMC - PubMed
    1. Challis R, Richards E, Rajan J, Cochrane G, Blaxter M.. BlobToolKit—interactive quality assessment of genome assemblies. G3 Genes|Genomes|Genetics. 2020:10:1361–1374. - PMC - PubMed

Publication types