. 2024 Jan 22;9(1):24.
doi: 10.1038/s41392-023-01726-8.

Bone-targeting engineered small extracellular vesicles carrying anti-miR-6359-CGGGAGC prevent valproic acid-induced bone loss

Affiliations

Bone-targeting engineered small extracellular vesicles carrying anti-miR-6359-CGGGAGC prevent valproic acid-induced bone loss

Xudong Xie et al. Signal Transduct Target Ther. .

Abstract

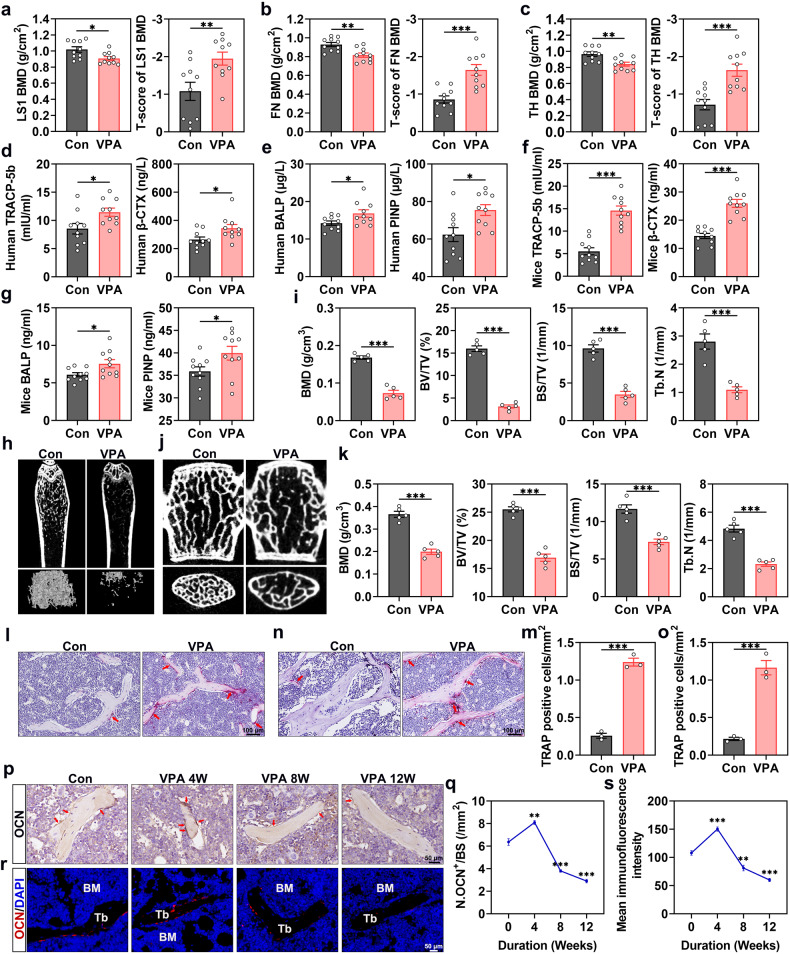
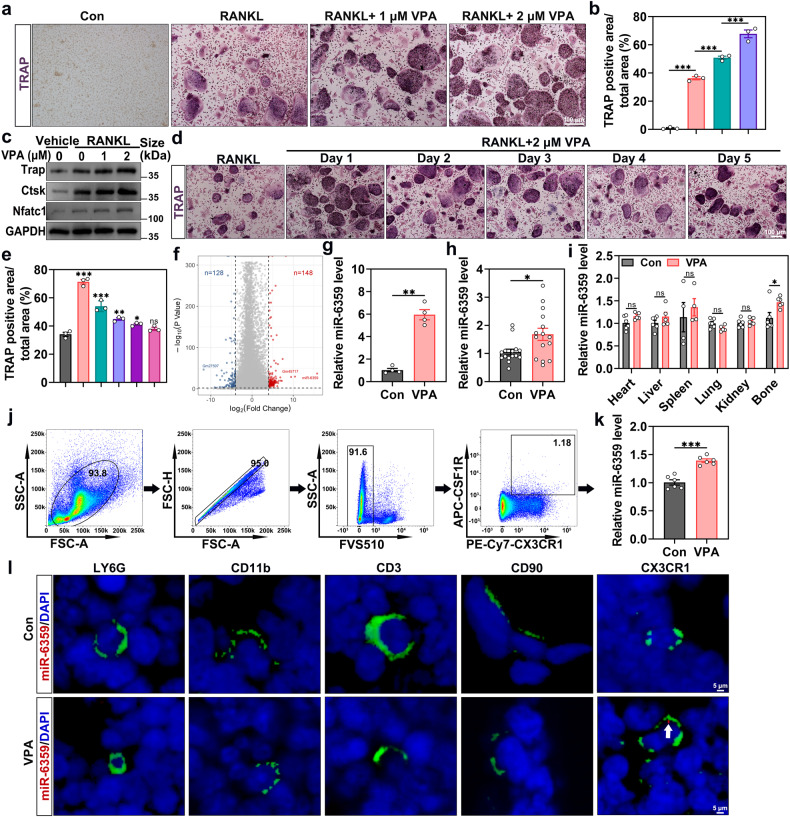
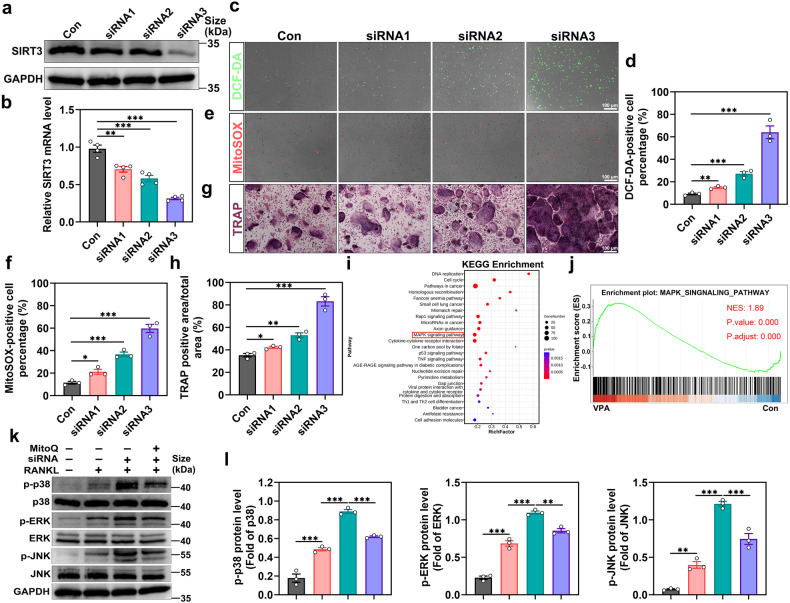
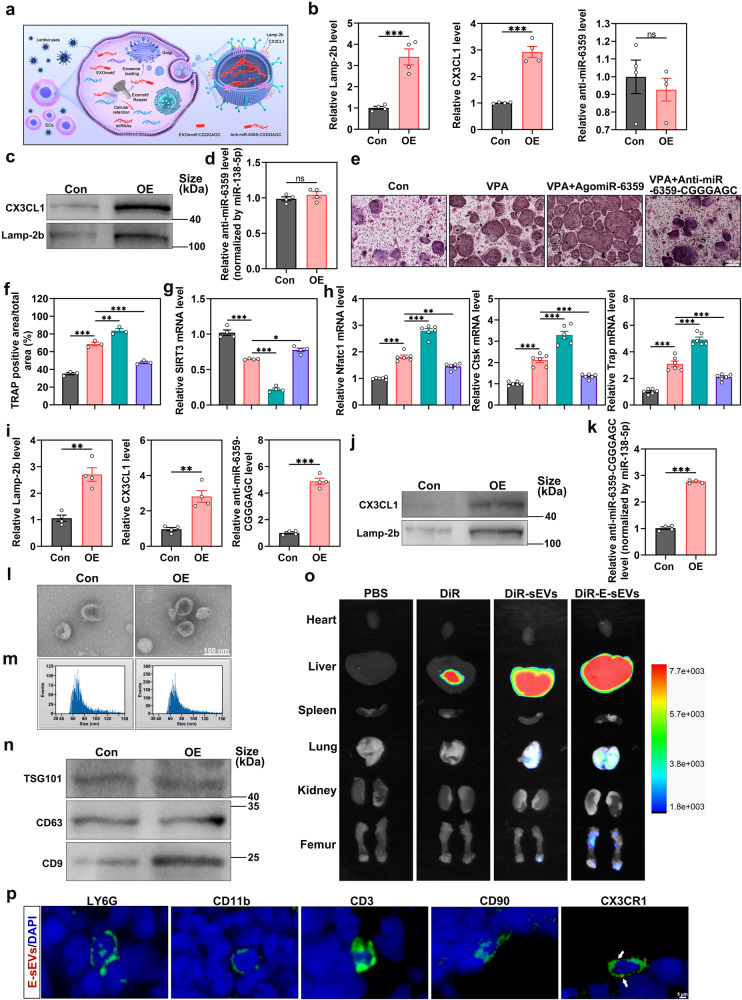
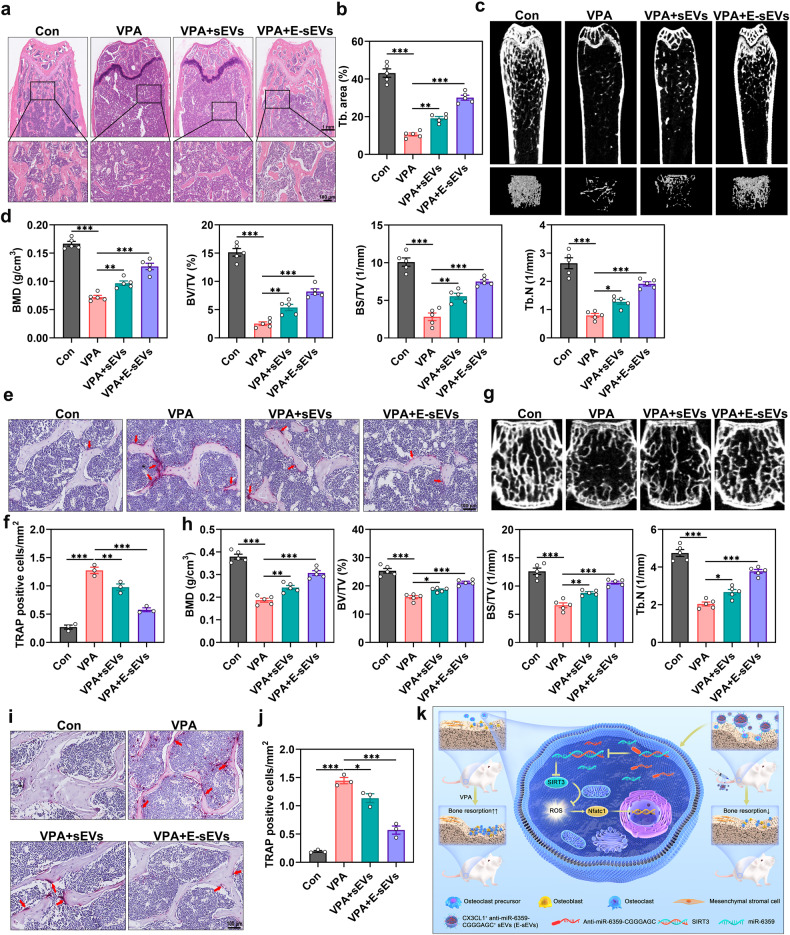
The clinical role and underlying mechanisms of valproic acid (VPA) on bone homeostasis remain controversial. Herein, we confirmed that VPA treatment was associated with decreased bone mass and bone mineral density (BMD) in both patients and mice. This effect was attributed to VPA-induced elevation in osteoclast formation and activity. Through RNA-sequencing, we observed a significant rise in precursor miR-6359 expression in VPA-treated osteoclast precursors in vitro, and further, a marked upregulation of mature miR-6359 (miR-6359) in vivo was demonstrated using quantitative real-time PCR (qRT-PCR) and miR-6359 fluorescent in situ hybridization (miR-6359-FISH). Specifically, the miR-6359 was predominantly increased in osteoclast precursors and macrophages but not in neutrophils, T lymphocytes, monocytes and bone marrow-derived mesenchymal stem cells (BMSCs) following VPA stimulation, which influenced osteoclast differentiation and bone-resorptive activity. Additionally, VPA-induced miR-6359 enrichment in osteoclast precursors enhanced reactive oxygen species (ROS) production by silencing the SIRT3 protein expression, followed by activation of the MAPK signaling pathway, which enhanced osteoclast formation and activity, thereby accelerating bone loss. Currently, there are no medications that can effectively treat VPA-induced bone loss. Therefore, we constructed engineered small extracellular vesicles (E-sEVs) targeting osteoclast precursors in bone and naturally carrying anti-miR-6359 by introducing of EXOmotif (CGGGAGC) in the 3'-end of the anti-miR-6359 sequence. We confirmed that the E-sEVs exhibited decent bone/osteoclast precursor targeting and exerted protective therapeutic effects on VPA-induced bone loss, but not on ovariectomy (OVX) and glucocorticoid-induced osteoporotic models, deepening our understanding of the underlying mechanism and treatment strategies for VPA-induced bone loss.


Conflict of interest statement

The authors declare no competing interests.

Figures

Fig. 1
Fig. 1
Bone loss is increased in patients undergoing VPA treatment and is associated with increased osteoclast formation. a LS1 BMD and the T-score of LS1 BMD (n = 10). b FN BMD and the T-score of FN BMD (n = 10). c TH BMD and the T-score of TH BMD (n = 10). d The TRACP-5b and β-CTX levels in the serum of patients (n = 10). e The BALP and PINP levels in the serum of patients (n = 10). f The serum concentrations of TRACP-5b and β-CTX levels in mice (n = 10). g The BALP and PINP levels in the serum of mice (n = 10). h Micro-CT images of the femurs in the control and VPA treatment groups (n = 5). i Quantitative analysis of trabecular bone. j Micro-CT images of the lumbar spine in the control and VPA treatment groups (n = 5). k Illustration of the corresponding morphometric measurements of trabecular bone. l, m TRAP staining and quantification of the femurs in control and VPA groups (n = 3). Scar bar: 100 μm. n, o TRAP staining and quantification of the lumbar spine in control and VPA groups (n = 3). Scar bar: 100 μm. p, q Representative images of osteocalcin (OCN) immunohistochemical staining and quantification of number of OCN-positive osteoblasts in distal femurs (n = 3). Red arrows represent OCN-positive cells. Scar bar: 50 μm. r, s Immunofluorescence staining for OCN and quantitative analysis of the images (n = 3). Scar bar: 50 μm. Data are presented as the mean ± SEM (n ≥ 3) (*p < 0.05; **p < 0.01; ***p < 0.001)
Fig. 2
Fig. 2
miR-6359 is enriched in VPA-treated osteoclast precursors and is responsible for osteoclast differentiation. a Representative images displaying the TRAP-positive multinuclear cells (n = 3). Scar bar: 100 μm. b Quantitative analysis of TRAP-positive area/total area (%). c Western blot analysis of the impact of VPA treatment on Nfatc1, Ctsk and Trap protein levels. d TRAP staining of osteoclast precursors treated with VPA at different stages of osteoclastogenesis (n = 3). Scar bar: 100 μm. e The area of TRAP-positive cells/total area (%) was counted. f Volcano plot showing genes or miRNAs with a cut-off fold-change of ≥ 4 or ≤ −4 and a p value of < 0.01. g qRT-PCR detection of the relative abundance of miR-6359 in osteoclast precursors treated with or without VPA (n = 4). h Relative abundance of miR-6359 in the serum of mice treated with or without VPA, as determined by qRT-PCR analysis (n = 15). i qRT-PCR detection of miR-6359 expression level in various tissues, such as heart, liver, spleen, lung, kidney and bone following VPA treatment (n = 4, 5 or 6). j, k CX3CR1+, Csf1R+ osteoclast precursors were identified (j) and the miR-6359 level was measured through qRT-PCR analysis (k) (n = 6). l miR-6359-FISH and immunofluorescence for LY6G, CD11b, CD3, CD90 and CX3CR1 were performed. Scar bar: 5 μm. Data are presented as the mean ± SEM (n ≥ 3) (*p < 0.05; **p < 0.01; ***p < 0.001)
Fig. 3
Fig. 3
SIRT3 is a target of miR-6359 during osteoclastogenesis. a Venn diagram showing the miR-6359 targets from miRWalk, TargetScan, miRDB database and OP-related genes. b qRT-PCR analysis of suspected miR-6359 targets (SIRT3, SET, WWTR1 and DMD) (n = 3 or 4). c Western blot quantification of SIRT3 expression level in osteoclast precursors with indicated treatments. d qRT-PCR analysis of SIRT3 expression level in osteoclast precursors with different treatment (n = 4). e Alignment between miR-6359 with the 3’ UTR of SIRT3 showing potential binding sites. f SIRT3 wild-type and mutant cell luciferase activity after transfection with agomiR-6359 or agomiR-NC (n = 4). g, h Immunofluorescence staining and quantitative analysis of SIRT3 in femoral sections of mice treated with vehicle or VPA (n = 3). Scar bar: 20 μm. i, j Immunofluorescence staining and quantification of SIRT3 in osteoclast precursors with indicated treatments (n = 3). Scar bar: 100 μm. k, l CX3CR1+, Csf1R+ osteoclast precursors were sorted by flow cytometry (k) and qRT-PCR analysis was used to detect the expression level of SIRT3 (l) (n = 5). Data are presented as the mean ± SEM (n ≥ 3) (*p < 0.05; **p < 0.01; ***p < 0.001)
Fig. 4
Fig. 4
SIRT3 inhibition promotes ROS production in osteoclast precursors and osteoclast formation via the MAPK signaling pathway. a Western blot quantification of SIRT3 expression in osteoclast precursors treated with SIRT3 siRNAs or negative control. b qRT-PCR analysis of SIRT3 expression in osteoclast precursors transfected with SIRT3 siRNAs or negative control (n = 4). c Approximately 4 × 104 osteoclast precursors were seeded in 24-well plates and grown overnight. After 24 h of incubation with SIRT3 siRNAs or negative control in the presence of 30 ng/ml M-CSF and 50 ng/ml RANKL, DCFH-DA staining was performed (n = 3). Scar bar: 100 μm. d Quantification of DCF-DA-positive cell percentage in (c). e Measurement of mitochondrial ROS using MitoSOX Red (n = 3). Scar bar: 100 μm. f Quantification of MitoSOX-positive cell percentage in (e). g TRAP-positive cells images after transfection (n = 3). Scar bar: 100 μm. h Quantitative analysis of TRAP-positive area/total area (%). i KEGG pathway enrichment analysis of differentially expressed genes (foldchange ≥2 or ≤ −2; p < 0.05). j GSEA of the MAPK signaling pathway. k Western blot showing p-JNK/JNK, p-ERK/ERK, and p-p38/p38 levels in osteoclast precursors following indicated treatments for 48 h with 30 ng/ml M-CSF and 50 ng/ml RANKL. l Quantitative analysis of western blots in (k). Data are presented as the mean ± SEM (n ≥ 3) (*p < 0.05; **p < 0.01; ***p < 0.001)
Fig. 5
Fig. 5
Construction of E-sEVs. a Schematic diagram showing the construction process of E-sEVs. b qRT-PCR analysis of Lamp-2b and CX3CL1 as well as anti-miR-6359 expression levels in osteoclast precursors infected with the Lamp-2b and CX3CL1-overexpressed lentivirus or negative controls (n = 4). c Western blot analysis of the expression of Lamp-2b and CX3CL1 proteins in sEVs derived from ECs after infection. d qRT-PCR analysis of anti-miR-6359 in sEVs (n = 4). e, f TRAP staining of osteoclasts (e), and their corresponding quantifications (f) (n = 3). Scar bar: 100 μm. g, h qRT-PCR detection of SIRT3 (g), Nfatc1, Ctsk and Trap (h) mRNA levels in osteoclast precursors following corresponding treatments (n = 4 or 6). i qRT-PCR analysis of Lamp-2b and CX3CL1 as well as anti-miR-6359-CGGGAGC expression levels in osteoclast precursors infected with pLenti-U6-anti-miR-6359-CGGGAGC-EF1N promoter-Lamp-2b (CX3CL1-Extra-sv40-puro)-sv40-puro lentivirus or negative controls (n = 4). j Western blot analysis showing the Lamp-2b and CX3CL1 protein levels in sEVs. k qRT-PCR analysis of anti-miR-6359-CGGGAGC in sEVs (n = 4). l SEVs morphology. Scar bar: 100 nm. m SEVs diameter distribution. n SEVs marker analysis by western blot. (o) Organ fluorescence of mice injected intravenously with PBS, dissolved DiR equivalents, DiR-labeled sEVs and DiR-labeled E-sEVs. p The femurs from mice treated with DiR-labeled E-sEVs were harvested and subjected to immunofluorescence staining for LY6G, CD11b, CD3, CD90 and CX3CR1. Scar bar: 5 μm. Data are presented as the mean ± SEM (n ≥ 3) (*p < 0.05; **p < 0.01; ***p < 0.001)
Fig. 6
Fig. 6
E-sEVs prevent VPA-induced bone loss. Mice aged eight weeks were treated with vehicle or VPA in combination with sEVs (VPA+sEVs) or E-sEVs (VPA + E-sEVs) for four weeks. a H&E staining of distal femur sections (n = 5). Scar bar: 1 mm and 100 μm. b Quantitative assessment of Tb.N in (a). c Micro-CT images of the femurs from control, VPA, VPA+sEVs and VPA + E-sEVs groups (n = 5). d Morphometric analyses of trabecular bone. e, f TRAP staining of the femurs isolated from mice subjected to various treatments and the corresponding quantification (n = 3). Scar bar: 100 μm. g Micro-CT images in the lumbar spine after corresponding treatments (n = 5). h Corresponding morphometric measurements of trabecular bone in (g). i, j TRAP staining of the lumbar spine sections and quantification of TRAP-positive cells (n = 3). Scar bar: 100 μm. k Schematic diagram showing the proposed mechanism of VPA-induced bone loss and how E-sEVs prevent it. Data are presented as the mean ± SEM (n ≥ 3) (*p < 0.05; **p < 0.01; ***p < 0.001)

References

    1. Silva AM, et al. Long noncoding RNAs: a missing link in osteoporosis. Bone Res. 2019;7:10. doi: 10.1038/s41413-019-0048-9. - DOI - PMC - PubMed
    1. Liang C, et al. Inhibition of osteoblastic Smurf1 promotes bone formation in mouse models of distinctive age-related osteoporosis. Nat Commun. 2018;9:3428. doi: 10.1038/s41467-018-05974-z. - DOI - PMC - PubMed
    1. Cummings SR, Melton LJ. Epidemiology and outcomes of osteoporotic fractures. Lancet. 2002;359:1761–1767. doi: 10.1016/S0140-6736(02)08657-9. - DOI - PubMed
    1. Compston JE, McClung MR, Leslie WD. Osteoporosis. Lancet. 2019;393:364–376. doi: 10.1016/S0140-6736(18)32112-3. - DOI - PubMed
    1. Ventura A, et al. Targeted deletion reveals essential and overlapping functions of the miR-17 through 92 family of miRNA clusters. Cell. 2008;132:875–886. doi: 10.1016/j.cell.2008.02.019. - DOI - PMC - PubMed

Publication types