. 2024 Jan 22;21(1):29.
doi: 10.1186/s12974-024-03019-5.

Microglia-derived exosomes modulate myelin regeneration via miR-615-5p/MYRF axis

Affiliations

Microglia-derived exosomes modulate myelin regeneration via miR-615-5p/MYRF axis

Xiao-Yu Ji et al. J Neuroinflammation. .

Abstract

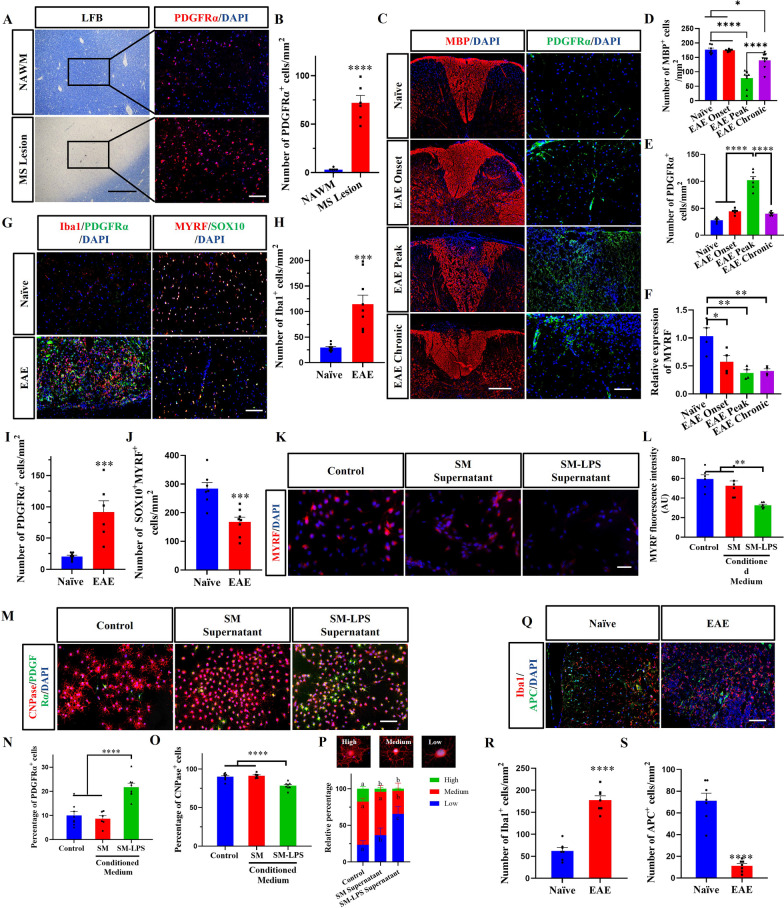
Demyelination and failure of remyelination in the central nervous system (CNS) characterize a number of neurological disorders. Spontaneous remyelination in demyelinating diseases is limited, as oligodendrocyte precursor cells (OPCs), which are often present in demyelinated lesions in abundance, mostly fail to differentiate into oligodendrocytes, the myelinating cells in the CNS. In addition to OPCs, the lesions are assembled numbers of activated resident microglia/infiltrated macrophages; however, the mechanisms and potential role of interactions between the microglia/macrophages and OPCs are poorly understood. Here, we generated a transcriptional profile of exosomes from activated microglia, and found that miR-615-5p was elevated. miR-615-5p bound to 3'UTR of myelin regulator factor (MYRF), a crucial myelination transcription factor expressed in oligodendrocyte lineage cells. Mechanistically, exosomes from activated microglia transferred miR-615-5p to OPCs, which directly bound to MYRF and inhibited OPC maturation. Furthermore, an effect of AAV expressing miR-615-5p sponge in microglia was tested in experimental autoimmune encephalomyelitis (EAE) and cuprizone (CPZ)-induced demyelination model, the classical mouse models of multiple sclerosis. miR-615-5p sponge effectively alleviated disease progression and promoted remyelination. This study identifies miR-615-5p/MYRF as a new target for the therapy of demyelinating diseases.

Keywords: Demyelinating disease; Exosomes; Microglia; OPCs; miR-615-5p.


Conflict of interest statement

We confirm this manuscript is original and has not been published before. We confirm that we do not have any commercial or associative interest that represents a conflict of interest in connection with the work submitted. The authors declare that they have no conflicts of interest to this work.

Figures

Fig. 1
Fig. 1
Microglia and OPCs were aggregated in the inflammatory microenvironment, and the differentiation of OPCs was inhibited. A Immunofluorescence staining of PDGFRα in the lesion of human brain sample, and B the number of PDGFRα+ cells per mm2. C Immunofluorescence staining of MBP and PDGFRα in spinal cords of naïve mice, and mice with EAE at disease onset (day 10 p.i.), peak (day 17 p.i.) and chronic phase (day 30 p.i.); and D, E quantitative MBP+ area per mm2 and the number of PDGFRα+ cells per mm2. F qRT-PCR of MYRF in spinal cords of naïve and EAE mice at different stages. G Immunofluorescence staining of Iba1/PDGFRα and MYRF/SOX10 (oligodendrocyte lineage cells marker) in spinal cords of naïve and EAE mice (day 17 p.i.), and HJ the number of Iba1+, PDGFRα+, SOX10+MYRF+ cells per mm2. K OPCs incubated with supernatant and immunofluorescence staining for MYRF, and L MYRF fluorescence intensity. M OPCs incubated with supernatant and immunofluorescence stained with PDGFRα and CNPase, and N, O percentage of PDGFRα+, CNPase+ cells per mm2. P The relative percentage of three differentiation stages of OPCs in each experimental group. Q Immunofluorescence staining of Iba1 and APC in spinal cords of naïve and EAE mice (day 17 p.i.), and R, S the number of Iba1+ and APC+ per mm2. Each data point represents the average of 4–6 regions of interest analyzed per section from at least 3 sections per animal with n ≥ 3 mice per group. Spinal cord samples analyzed in the white matter lesion area (C, G, Q). Typical representative figures show the dorsal cord lesion area of the spinal cord (C). All data are represented by mean ± SEM. T-test was used to determine P values (B, H, I, J, R, S). One-way ANOVA was used to determine P values (D, E, F, L, N, O). * P < 0.05, **P < 0.01, ***P < 0.001, ****P < 0.0001.Two-way ANOVA was used to determine P values (P). Groups that do not share the same letter are significantly (P < 0.05). One representative of three independent experiments is shown. Scale bar = 200 μm (the left part of figure A and C), 100 μm (A, the right part of A and C, G, M, P), and 50 μm (K)
Fig. 2
Fig. 2
EXOs-LPS (exosomes in SM-LPS supernatant) inhibited OPCs differentiation. A NTA and TEM analyses to detect EXOs/EXOs-LPS particle size and apparent morphology. B Uptake of ExoGlow membrane labeling EXOs/EXOs-LPS by OPCs. C Schematic diagram of co-incubation of OPCs with EXOs/EXOs-LPS. D Immunofluorescence staining of OPCs differentiation after treatment with EXOs/EXOs-LPS, and E, F percentage of PDGFRα+ and CNPase+ cells. The dosage of EXOs was 2 × 108 particles. G The relative percentage of three differentiation stages of OPCs in each experimental group. H Immunofluorescence staining to determine the expression intensity of MYRF after OPCs treatment with EXOs/EXOs-LPS, and I MYRF fluorescence intensity. Each data point represents the average of at least 4-6 regions of interest analyzed in each well, n ≥ 3 wells per group. All data are represented by mean ± SEM. One-way ANOVA was used to determine P values (E, F, I). **P < 0.01, ***P < 0.001, ****P < 0.0001. Two-way ANOVA was used to determine P values (G). Groups that do not share the same letter are significantly (P < 0.05). One representative of three independent experiments is shown. Scale bar = 100 nm (A), 20 μm (B), and 100 μm (D, H)
Fig. 3
Fig. 3
Exosome miRNA expression analysis and target gene prediction. A Gene expression heat maps and B volcano plots of miRNAs with significantly different expressions in EXOs/EXOs-LPS. C miR-615-5p target gene network expression map. D Schematic diagram of ExoView analysis. E ExoView detected the miR-615-5p of EXOs and EXOs-LPS by the specific probe and F the percentage of miR-615-5p+ particles. G FISH detected the expression of miR-615-5p in SM and SM-LPS, and H the miR-615-5p fluorescence intensity. I Immunofluorescence staining and FISH detected the expression of Iba1 and miR-615-5p in EAE/naïve spinal cords, and J the number of Iba1+miR-615-5p+ cells per mm2. K miRDB, TargetScan, and miRWalk online tools obtained miR-615-5p target genes related to OPCs differentiation. Sequencing data in 3 groups, each group n = 3 (A). Each data point represents the average of at least 4-6 regions of interest analyzed in each well, n ≥ 3 wells per group (EJ). All data are represented by mean ± SEM. t-tests were used to determine P values (H, J). Two-way ANOVA was used to determine P values (F). *P < 0.05, **P < 0.01. One representative of three independent experiments is shown. Scale bar = 5 μm (E), 20 μm (G) and 100 μm (I)
Fig. 4
Fig. 4
EXOs-LPS-derived miR-615-5p can target MYRF 3′UTR. A Schematic diagram of targeted binding sequence between miR-615-5p and MYRF 3′UTR. B Luciferase activity was tested by the one-GLo™ EX Luciferase Assay System in 293 T cells. C After OPCs transfection with miR-615-5p mimics, the expressions of MYRF and β-actin were detected by qRT-PCR. D After OPCs transfection with miR-615-5p mimics, the expressions of MYRF and β-actin were detected by WB, and E is the quantification of MYRF by Image J software. F CNPase and Olig2 were immunostained for the OPCs transfected with miR-615-5p mimics. The magnification of cells is shown on the right. G The percentage of CNPase+Olig2+ cell numbers divided by the total number of cells. H The relative percentage of three differentiation stages of OPCs in each experimental group. I Immunofluorescence staining to detect the expression of CNPase, and J the percentage of CNPase+ cells. Each data point represents the average of at least 4-6 regions of interest analyzed in each well, n ≥ 3 wells per group. All data are represented by mean ± SEM. T-tests were used to determine P values (C, E). One-way ANOVA was used to determine P values (B, G, J). *P < 0.05, **P < 0.01, ***P < 0.001. Two-way ANOVA was used to determine P values (H). One representative of three independent experiments is shown. Scale bar = 100 μm (F, I)
Fig. 5
Fig. 5
Antagonizing miR-615-5p in microglia significantly alleviated EAE development. A Mice were divided into three groups: PBS group, AAV-Scramble group, and AAV-miR-615-5p-Sponge group. Two days before immunization, AAVs were injected into mice via the lateral ventricles. After 27 days of immunization, spinal cords, and brains were harvested, and HE, LFB, IF, TEM, qRT-PCR, and WB were performed. B Immunofluorescence staining of Iba1 and GFP and local magnification in each group is shown on the right, and C the number of Iba1+GFP+ cells per mm2. D, E qRT-PCR analysis of miR-615-5p in mouse brain and spinal cords. F Clinical score of EAE mice. The @ symbol represents the comparison between the PBS group and the AAV-miR-615-5p-Sponge group. The # symbol represents the AAV-Scramble group compared with the AAV-miR-615-5p-Sponge group. G The cumulative scores were calculated from day 10 to day 27 p.i. H Spinal cords were assayed for H&E staining, I LFB staining, and J MBP fluorescence staining. The lower rows of (KM) showed the locally enlarged images of H&E, LFB, and MBP staining in each group. The red circle represents inflammatory cell infiltration in (H). K, L Statistical results of H&E and LFB pathological scores. M MBP+ area per mm2. Each data point represents the average of 4–6 regions of interest analyzed per section from at least 3 sections per animal with n ≥ 3 mice per group. Spinal cord samples analyzed in the white matter lesion area (B, H, I, J). Typical representative figures show the dorsal cord lesion area of the spinal cord (B, J). All data are represented by mean ± SEM. One-way ANOVA was used to determine P values (C, D, E, G, K, M, L). Two-way ANOVA was used to determine P values (E). @P < 0.05 (day 15-27), #P < 0.05 (day 24–27), *P < 0.05, **P < 0.01, ****P < 0.0001. One representative of three independent experiments is shown. Scale bar = 100 μm (B) and 500 μm (GI)
Fig. 6
Fig. 6
Antagonizing miR-615-5p can alleviate demyelination in EAE mice. A Immunolabeling of PDGFRα and APC in the spinal cords, and B, C the number of PDGFRα+ and APC+ cells per mm2. D TEM images of the spinal cords in different experimental groups. Magnified views of partial myelin sheaths are shown below. Red represents regenerated myelin, yellow represents demyelinated sheath, and blue represents normal myelin. E Number of remyelinated axons. F Percentage of myelinated axons to total axons. G Scatter plot of myelin sheath thickness. H Quantification of the G-ratios (axon diameter/fiber diameter) of myelinated fibers. I, J The expression of MYRF and MBP mRNA was detected by qRT-PCR in the brain and spinal cords. K After antagonizing miR-615-5p, the expressions of MYRF, MBP, and β-actin in the spinal cords were detected by WB. L, M Image J software quantification statistical results. Each data point represents the average of 4–6 regions of interest analyzed per section from at least 3 sections per animal with n ≥ 3 mice per group. Spinal cord samples analyzed in the white matter lesion area (A, D). Typical representative figures show the dorsal cord lesion are of the spinal cord(A). All data are represented by mean ± SEM. One-way ANOVA was used to determine P values (B, C, EH, L, M). Two-way ANOVA was used to determine P values (I, J). *P < 0.05, **P < 0.01, ***P < 0.001, ****P < 0.0001. One representative of three independent experiments is shown. Scale bar = 100 μm (A) and 2 μm (D)
Fig. 7
Fig. 7
Antagonizing miR-615-5p in microglia significantly alleviated demyelination in the CPZ model. A Mice were divided into four groups: Naïve group, CPZ group, AAV-Scramble group, and AAV-miR-615-5p-Sponge group. One week after feeding 0.2% CPZ diet, AAVs were injected into mice via the lateral ventricles. After 5 weeks of feeding 0.2% CPZ diet, the behavioral test was performed, and brains were harvested for black gold and IF testing. B, C The motor coordinative function was assessed by tight rope test and fatigue baton twister test. D Immunofluorescence staining of Iba1 and GFP in each group is shown, and E the number of Iba1+GFP+ cells per mm2. F Black gold staining of myelinated axons and G Black gold myelin per area. H TEM images of the brains in different experimental groups. I Percentage of myelinated axons to total axons. J Quantifying the G-ratios (axon diameter/fiber diameter) of myelinated fibers. K Scatter plots of myelin sheath thickness. L Immunolabeling of PDGFRα and APC in the Brains, and M, N the number of PDGFRα+ and APC+ cells per mm2. O Immunolabeling of MYRF and SOX10 in the Brains, and P the number of MYRF+ SOX10+ cells per mm2. Each data point represents the average of 4–6 regions of interest analyzed per section from at least 3 sections per animal with n ≥ 3 mice per group. Sites of lesions in the CC region analyzed in mouse brain samples. One-way ANOVA was used to determine P values (B, C, E, G, I, J, K, M, N, P). *P < 0.05, **P < 0.01, ***P < 0.001, ****P < 0.0001. One representative of three independent experiments is shown. Scale bar = 50 μm (D, L, O) and 5 μm (F)
Fig. 8
Fig. 8
Diagram of mechanism. In an inflammatory environment, resting microglia transform into activated microglia. The exosomes released by activated microglia can serve as their cellular communication with OPCs. In addition, miR-615-5p was expressed highly in activated microglia-derived exosomes, which silenced MYRF and ultimately led to the obstruction of OPCs differentiation

Similar articles

Cited by

References

    1. Zhang Y, Li X, Ciric B, Curtis MT, Chen WJ, Rostami A, et al. A dual effect of ursolic acid to the treatment of multiple sclerosis through both immunomodulation and direct remyelination. Proc Natl Acad Sci USA. 2020;117(16):9082–9093. doi: 10.1073/pnas.2000208117. - DOI - PMC - PubMed
    1. Martin NA, Hyrlov KH, Elkjaer ML, Thygesen EK, Wlodarczyk A, Elbaek KJ, et al. Absence of miRNA-146a differentially alters microglia function and proteome. Front Immunol. 2020;11:1110. doi: 10.3389/fimmu.2020.01110. - DOI - PMC - PubMed
    1. Tsai HH, Niu J, Munji R, Davalos D, Chang J, Zhang H, et al. Oligodendrocyte precursors migrate along vasculature in the developing nervous system. Science (New York, NY) 2016;351(6271):379–384. doi: 10.1126/science.aad3839. - DOI - PMC - PubMed
    1. Chamberlain KA, Huang N, Xie Y, LiCausi F, Li S, Li Y, et al. Oligodendrocytes enhance axonal energy metabolism by deacetylation of mitochondrial proteins through transcellular delivery of SIRT2. Neuron. 2021;109(21):3456–72.e8. doi: 10.1016/j.neuron.2021.08.011. - DOI - PMC - PubMed
    1. Falcão AM, van Bruggen D, Marques S, Meijer M, Jäkel S, Agirre E, et al. Disease-specific oligodendrocyte lineage cells arise in multiple sclerosis. Nat Med. 2018;24(12):1837–1844. doi: 10.1038/s41591-018-0236-y. - DOI - PMC - PubMed

Substances

LinkOut - more resources