. 2024 Jan 22;43(1):25.
doi: 10.1186/s13046-024-02947-7.

The dopamine receptor D1 inhibitor, SKF83566, suppresses GBM stemness and invasion through the DRD1-c-Myc-UHRF1 interactions

Affiliations

The dopamine receptor D1 inhibitor, SKF83566, suppresses GBM stemness and invasion through the DRD1-c-Myc-UHRF1 interactions

Zhiyi Xue et al. J Exp Clin Cancer Res. .

Abstract

Background: Extensive local invasion of glioblastoma (GBM) cells within the central nervous system (CNS) is one factor that severely limits current treatments. The aim of this study was to uncover genes involved in the invasion process, which could also serve as therapeutic targets. For the isolation of invasive GBM cells from non-invasive cells, we used a three-dimensional organotypic co-culture system where glioma stem cell (GSC) spheres were confronted with brain organoids (BOs). Using ultra-low input RNA sequencing (ui-RNA Seq), an invasive gene signature was obtained that was exploited in a therapeutic context.

Methods: GFP-labeled tumor cells were sorted from invasive and non-invasive regions within co-cultures. Ui-RNA sequencing analysis was performed to find a gene cluster up-regulated in the invasive compartment. This gene cluster was further analyzed using the Connectivity MAP (CMap) database. This led to the identification of SKF83566, an antagonist of the D1 dopamine receptor (DRD1), as a candidate therapeutic molecule. Knockdown and overexpression experiments were performed to find molecular pathways responsible for the therapeutic effects of SKF83566. Finally, the effects of SKF83566 were validated in orthotopic xenograft models in vivo.

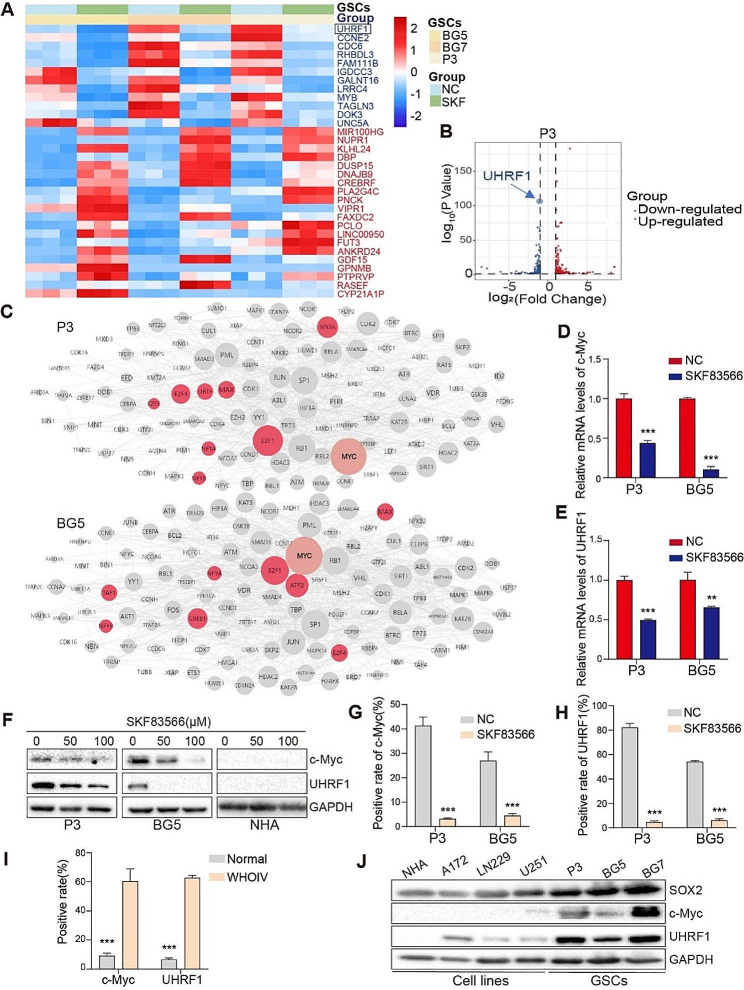
Results: Ui-RNA seq analysis of three GSC cell models (P3, BG5 and BG7) yielded a set of 27 differentially expressed genes between invasive and non-invasive cells. Using CMap analysis, SKF83566 was identified as a selective inhibitor targeting both DRD1 and DRD5. In vitro studies demonstrated that SKF83566 inhibited tumor cell proliferation, GSC sphere formation, and invasion. RNA sequencing analysis of SKF83566-treated P3, BG5, BG7, and control cell populations yielded a total of 32 differentially expressed genes, that were predicted to be regulated by c-Myc. Of these, the UHRF1 gene emerged as the most downregulated gene following treatment, and ChIP experiments revealed that c-Myc binds to its promoter region. Finally, SKF83566, or stable DRD1 knockdown, inhibited the growth of orthotopic GSC (BG5) derived xenografts in nude mice.

Conclusions: DRD1 contributes to GBM invasion and progression by regulating c-Myc entry into the nucleus that affects the transcription of the UHRF1 gene. SKF83566 inhibits the transmembrane protein DRD1, and as such represents a candidate small therapeutic molecule for GBMs.

Keywords: DRD1; Glioma stem cells; Invasion; SKF83566; UHRF1; c-Myc.


Conflict of interest statement

The authors declare no conflicts of interest.

Figures

Fig. 1
Fig. 1
SKF83566 is a potential therapeutic agent for targeting malignant human glioma. (A) Schematic representation of the brain organoid and GBM spheroid co-culture ex-vivo model, and the heat maps obtained through ultra-low input RNA sequencing analysis and identification of a 27 invasion-related gene signature (Venn Diagram). Analysis of these genes by the CMap database yielded SKF83566 as a potential drug targeting their expression. (B) Cell viability of four GBM cell lines (U251, LN18, LN229, and A172), three human GSCs (P3, BG5 and BG7) and NHA cells following SKF83566 treatment using the CellTiter-Glo assay. Data are shown as the mean ± SEM. Statistical significance was determined with the two-way ANOVA. NHA compared with each cell line and each GSCs, with p-values all less than 0.001. (C) IC50 values following SKF83566 treatment for the 8 cell types. (D) Extreme limiting dilution assay performed with P3, BG5 and BG7 human GSCs. (E)Representative images from tumorsphere formation assays for P3, BG5 and BG7 human GSCs treated with SKF83566. Scale bar = 200 μm. (F) Statistical analysis of tumorsphere formation assays for P3, BG5 and BG7 human GSCs treated with SKF83566 using ANOVA. Data are shown as the mean ± SEM. *** P < 0.001. (G) Western blot analysis of caspase-7, CDK4, PCNA levels in GBM patient derived P3, BG5, and BG7 human GSCs treated with SKF83566
Fig. 2
Fig. 2
SKF83566 inhibits GBM invasion in vitro and in vivo. (A) Representative images from co-culture invasion assays for P3, BG5, and BG7 human GSCs treated with SKF83566 (Scale bar = 100 μm) and (B) quantitative representation of invasive ratios. Data are shown as the mean ± SEM. Statistical significance was determined by the unpaired Student’s t-test. ***P < 0.001. (C and D) Representative images of spheroids in 3D invasion assays for P3, BG5, and BG7 human GSCs treated with SKF83566, and evaluated at 96 h. Scale bar = 200 μm. Graphic representation of invasive ratios from 3D invasion assays for P3, BG5 and BG7 human GSCs treated with SKF83566. The quantification of the distance of invading cells from the tumor spheres was determined after 96 h. Data are shown as the mean ± SEM. The unpaired Student’s t-test determined statistical significance. ***P < 0.001. (E) Schematic depiction of the schedule for implantation and drug treatment in vivo. Ten days after implantation of tumor cells, mice were treated with SKF83566 by intraperitoneal injection (20 mg/kg/day). Bioluminescence imaging (BLI) was performed at days 10, 17, 24 and 31. Nude mouse image was obtained from the Biorender webpage. (F and G) Bioluminescence images and the corresponding quantification of bioluminescence intensities, reflecting tumor burden, were obtained in mice implanted with P3 cells at days 10, 17 and 24 (n = 5 per group). Data are shown as mean ± SEM. Statistical significance was determined with ANOVA. ***P < 0.001. (H) The survival curves of tumor-bearing mice implanted with P3 cells treated with SKF83566 or vehicle control (DMSO) (n = 5 per group). A log-rank test was used to assess statistical significance. Data are shown as mean ± SEM. **P < 0.01. (I) Representative hematoxylin and eosin staining of mouse brains implanted with P3. (I above) Scale bar = 2.5 mm, (I below) Scale bar = 500 μm. (J) Quantification of immunohistochemical staining for Ki67 in sections from P3 and BG5 xenografts. Data are shown as the mean ± SEM. Unpaired Student’s t-test determined statistical significance. ***P < 0.001
Fig. 3
Fig. 3
DRD1 is the target of SKF83566 in human GSCs. (A) SwissTargetPrediction of the interaction of SKF83566 with the predicted target DRD1. (B) Western blots to detect protein levels of DRD1 in NHA, three GBM cell lines (A172, LN229, and U251), and three human GSCs (P3, BG5 and BG7). (C) Western blot to confirm siRNA knockdown efficiency of DRD1 in P3 and BG5 human GSCs. (D) Extreme limiting dilution assay performed with P3, BG5 human GSCs transfected with si-DRD1. (E) Quantification of the tumorsphere formation assays for P3 and BG5 GSCs transfected with si-NC, si-DRD1-2 or si-DRD1-3. Data are shown as the mean ± SEM. Statistical significance was determined by ANOVA. ***P < 0.001. (F and G) Representative images and quantification of the co-culture invasion assays for P3 and BG5 human GSCs transfected with si-NC, si-DRD1-2 or si-DRD1-3. Scale bar = 100 μm. Data are shown as the mean ± SEM. Statistical significance was determined by ANOVA. ***P < 0.001. (H and I) Representative images from tumorsphere formation assays for P3 and BG5 human GSCs through overexpression of DRD1 followed by SKF83566 treatment. Scale bar = 200 μm. Data are shown as the mean ± SEM. Statistical significance was determined by the unpaired Student’s t-test. *P < 0.05, **P < 0.01 and ***P < 0.001. (J and K) Representative images of spheroids in the 3D invasion assays for P3- and BG5-DRD1-OE/-NC (overexpression of DRD1 or control) followed by SKF83566 treatment, and evaluated at 96 h. Scale bar = 200 μm. Quantification of the distance of invading cells from the tumorspheres determined after 96 h. Data are shown as the mean ± SEM. Statistical significance was determined by the unpaired Student’s t-test. **P < 0.01 and ***P < 0.001
Fig. 4
Fig. 4
SKF83566 suppresses c-Myc and UHRF1 in vitro and in vivo. (A) Hierarchical clustering based on the differentially expressed genes obtained through RNA sequencing of P3, BG5 and BG7 human GSCs treated with SKF83566 or DMSO (vehicle control). (B) Volcano plot of differentially expressed genes in P3 human GSCs treated with SKF83566. (C) Interaction network of transcription factors enriched from sequencing data in P3 and BG5 human GSCs through Expression2Kinases. (D and E) Quantitative RT-PCR for c-Myc and UHRF1 in P3 and BG5 human GSCs treated with SKF83566. Data are shown as the mean ± SEM. Statistical significance was determined by the unpaired Student’s t-test. **P < 0.01 and ***P < 0.001. (F) Western blot of c-Myc and UHRF1 in SKF83566-treated NHA, P3 and BG5 human GSCs. (G and H) Statistical analysis of immunohistochemical staining for c-Myc and UHRF1 in sections from orthotopic xenografts derived from P3 and BG5 human GSCs in mice using the unpaired Student’s t-test. Data are shown as the mean ± SEM. *** P < 0.001. (I) Quantification of immunostaining for c-Myc and UHRF1 in normal brain tissues and WHO grade IV gliomas. Data are shown as mean ± SEM. Statistical significance was determined by the unpaired Student’s t-test. ***P < 0.001. (J) Western blots showing SOX2, c-Myc, and UHRF1 expression in NHA, three GBM cell lines (A172, LN229, and U251), and three human GSCs (P3, BG5 and BG7)
Fig. 5
Fig. 5
c-Myc is a transcriptional regulator of UHFR1 which promotes stemness and invasion of GBM human GSCs. (A) Western blots to confirm siRNA knockdown efficiency of UHRF1 in P3 and BG5 GSCs. (B) Extreme limiting dilution assay performed with P3 and BG5 human GSCs transfected with si-NC, si-UHRF1-2 or si-UHRF1-3. Data are shown as the mean ± SEM. Statistical significance was determined by ANOVA. (C) Quantification of the tumorsphere formation assays for P3 and BG5 GSCs transfected with si-NC, si-UHRF1-2 or si-UHRF1-3. Data are shown as the mean ± SEM. Statistical significance was determined by ANOVA. ***P < 0.001. (D) Quantification of the invasion in the 3D invasion spheroids assays for P3 and BG5 transfected with si-NC, si-UHRF1-2 or si-UHRF1-3. All data are presented as the mean ± SEM, Statistical significance was determined by ANOVA. ***P < 0.001. (E) Western blots to confirm siRNA knockdown efficiency of c-Myc in P3 and BG5 human GSCs. (F and G) Representative images and statistical analysis from tumorsphere formation assays for P3 and BG5-c-Myc-OE/-NC human GSCs (overexpression of c-Myc or control) treated with SKF83566. Scale bar = 200 µm. Data are shown as the mean ± SEM. Statistical significance was determined by the unpaired Student’s t-test. *P < 0.05, **P < 0.01 and ***P < 0.001. (H) Statistical analysis from 3D invasion spheroids assays for P3 and BG5-c-Myc-OE/-NC treated with SKF83566. Data are shown as the mean ± SEM Statistical significance was determined by unpaired Student’s t-test. **P < 0.01, ***P < 0.001. (I) Predicted c-Myc transcriptional binding sites from the JASPER database. (J) Quantification of the ChIP-PCR assay performed with antibodies against c-Myc to detect c-Myc binding to the UHRF1 promoter. Input was used for normalization and IgG was used for negative control. Data are shown as the mean ± SEM. Statistical significance was determined by unpaired Student’s t-test. **P < 0.01. (K) Construction of wild type (WT) and mutant (MUT) luciferase reporter vectors based on the predicted binding site of c-Myc in the 3’ UTR of UHRF1. (L) Quantification of luciferase activity from HEK293t cells co-transfected with the reporter vectors and c-Myc-OE or c-Myc-NC. Luciferase activity was assessed 48 h after transfection. Data are shown as the mean ± SEM. Statistical significance was determined by the unpaired Student’s t-test. ****P < 0.0001
Fig. 6
Fig. 6
Anti-tumor activity of SKF83566 targets the DRD1-cMyc-UHRF1 axis in vitro and in vivo. (A) Quantitative RT-PCR for c-Myc in P3 and BG5 human GSCs transfected with si-NC, si-DRD1-2 or si-DRD1-3. Data are shown as the mean ± SEM. Statistical significance was determined by ANOVA. ***P < 0.001. (B) Western blots to detect c-Myc and UHRF1 in P3 and BG5-DRD1-OE human GSCs (overexpression of DRD1) treated with SKF83566. (C and D) Bioluminescence images and the corresponding quantification of tumor burden in mice implanted with BG5-sh-NC or -sh-DRD1 human GSCs at days 30, 44, and 84. (n = 5 per group). Data are shown as mean ± SEM. Statistical significance was determined by ANOVA. **P < 0.01. (E) Representative hematoxylin and eosin staining of mouse brains implanted with BG5-sh-DRD1/sh-NC cells. Scale bar = 2.5 mm (Left) and 500 μm (Right). (F) The survival curves of tumor-bearing mice implanted with BG5-sh-DRD1/sh-NC cells (n = 5 per group). A log-rank test was used to assess statistical significance. Data are shown as mean ± SEM. **P < 0.05. (G) Quantification of immunohistochemistry for c-Myc, UHRF1, and Ki67 in sections from BG5-sh-DRD1/sh-DRD1-NC xenografts. Data are shown as the mean ± SEM. Statistical significance was determined by unpaired Student’s t-test. ***P < 0.001. (H) Schematic diagram of SKF83566 targeting the DRD1-c-Myc-UHRF1 axis inhibiting GSC invasion and stemness

References

    1. Bhaduri A, et al. Outer radial glia-like Cancer stem cells contribute to heterogeneity of Glioblastoma. Cell Stem Cell. 2020;26(1):48–63e6. doi: 10.1016/j.stem.2019.11.015. - DOI - PMC - PubMed
    1. Venkataramani V, et al. Glioblastoma hijacks neuronal mechanisms for brain invasion. Cell. 2022;185(16):2899–2917e31. doi: 10.1016/j.cell.2022.06.054. - DOI - PubMed
    1. Sun T, et al. Substance P mediated DGLs complexing with DACHPt for Targeting Therapy of Glioma. ACS Appl Mater Interfaces. 2017;9(40):34603–17. doi: 10.1021/acsami.7b05997. - DOI - PubMed
    1. Tan A, et al. Management of glioblastoma: state of the art and future directions. Cancer J Clin. 2020;70(4):299–312. doi: 10.3322/caac.21613. - DOI - PubMed
    1. Gao X, et al. Acute and fractionated irradiation differentially modulate glioma stem cell division kinetics. Cancer Res. 2013;73(5):1481–90. doi: 10.1158/0008-5472.CAN-12-3429. - DOI - PMC - PubMed

MeSH terms

Substances