

Exploring the effects of dietary inulin in rainbow trout fed a high-starch, 100% plant-based diet
- PMID: 38247008
- PMCID: PMC10802069
- DOI: 10.1186/s40104-023-00951-z
Exploring the effects of dietary inulin in rainbow trout fed a high-starch, 100% plant-based diet
Abstract
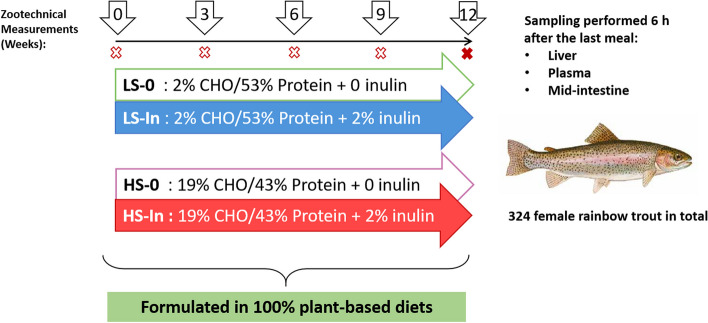
Background: High dietary carbohydrates can spare protein in rainbow trout (Oncorhynchus mykiss) but may affect growth and health. Inulin, a prebiotic, could have nutritional and metabolic effects, along with anti-inflammatory properties in teleosts, improving growth and welfare. We tested this hypothesis in rainbow trout by feeding them a 100% plant-based diet, which is a viable alternative to fishmeal and fish oil in aquaculture feeds. In a two-factor design, we examined the impact of inulin (2%) as well as the variation in the carbohydrates (CHO)/plant protein ratio on rainbow trout. We assessed the influence of these factors on zootechnical parameters, plasma metabolites, gut microbiota, production of short-chain fatty acids and lactic acid, as well as the expression of free-fatty acid receptor genes in the mid-intestine, intermediary liver metabolism, and immune markers in a 12-week feeding trial.
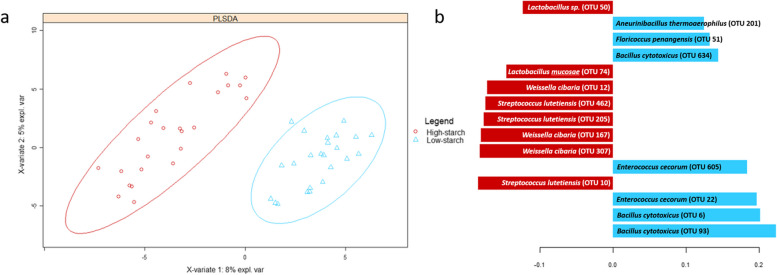
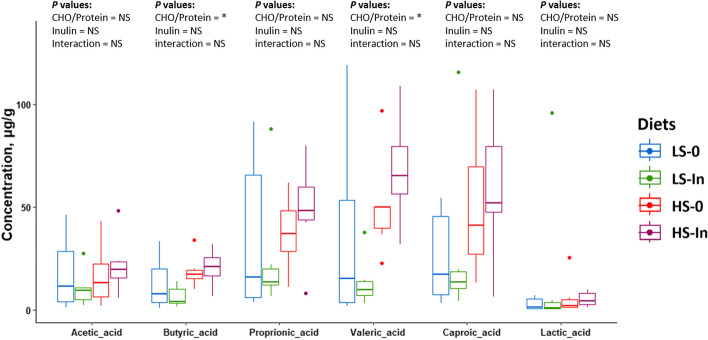
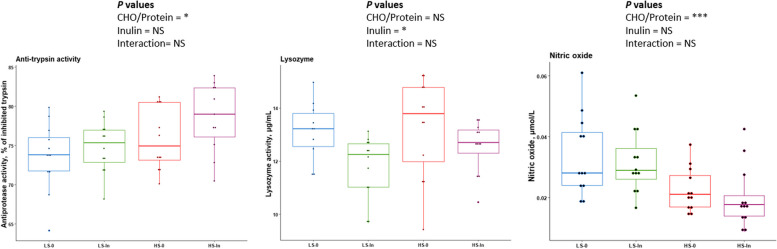
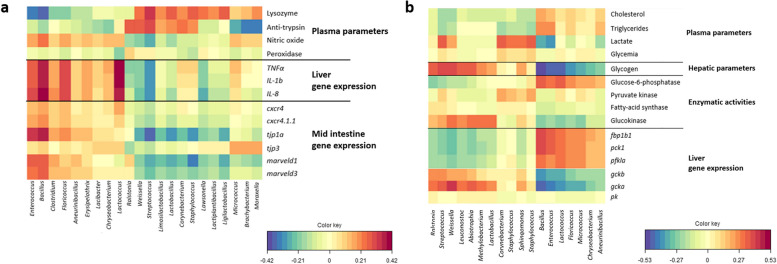
Results: The use of 2% inulin did not significantly change the fish intestinal microbiota, but interestingly, the high CHO/protein ratio group showed a change in intestinal microbiota and in particular the beta diversity, with 21 bacterial genera affected, including Ralstonia, Bacillus, and 11 lactic-acid producing bacteria. There were higher levels of butyric, and valeric acid in groups fed with high CHO/protein diet but not with inulin. The high CHO/protein group showed a decrease in the expression of pro-inflammatory cytokines (il1b, il8, and tnfa) in liver and a lower expression of the genes coding for tight-junction proteins in mid-intestine (tjp1a and tjp3). However, the 2% inulin did not modify the expression of plasma immune markers. Finally, inulin induced a negative effect on rainbow trout growth performance irrespective of the dietary carbohydrates.
Conclusions: With a 100% plant-based diet, inclusion of high levels of carbohydrates could be a promising way for fish nutrition in aquaculture through a protein sparing effect whereas the supplementation of 2% inulin does not appear to improve the use of CHO when combined with a 100% plant-based diet.
Keywords: Aquaculture; Fish nutrition; Gut microbiota; Immune markers; Intermediary metabolism; Inulin; Prebiotic; Rainbow trout; Short-chain fatty acids.
© 2024. The Author(s).
Conflict of interest statement
We declare no conflicts of interest.
Figures


Similar articles
-
Rapid adaptation of the rainbow trout intestinal microbiota to the use of a high-starch 100% plant-based diet.FEMS Microbiol Lett. 2024 Jan 9;371:fnae039. doi: 10.1093/femsle/fnae039. FEMS Microbiol Lett. 2024. PMID: 38851245
-
Next generation sequencing for gut microbiome characterization in rainbow trout (Oncorhynchus mykiss) fed animal by-product meals as an alternative to fishmeal protein sources.PLoS One. 2018 Mar 6;13(3):e0193652. doi: 10.1371/journal.pone.0193652. eCollection 2018. PLoS One. 2018. PMID: 29509788 Free PMC article.
-
Does broodstock nutritional history affect the response of progeny to different first-feeding diets? A whole-body transcriptomic study of rainbow trout alevins.Br J Nutr. 2016 Jun;115(12):2079-92. doi: 10.1017/S0007114516001252. Epub 2016 Apr 26. Br J Nutr. 2016. PMID: 27112276
-
Effects of replacing fishmeal with cottonseed protein concentrate on growth performance, blood metabolites, and the intestinal health of juvenile rainbow trout (Oncorhynchus mykiss).Front Immunol. 2022 Dec 21;13:1079677. doi: 10.3389/fimmu.2022.1079677. eCollection 2022. Front Immunol. 2022. PMID: 36618404 Free PMC article.
-
Intestinal microbial communities of rainbow trout (Oncorhynchus mykiss) may be improved by feeding a Hermetia illucens meal/low-fishmeal diet.Fish Physiol Biochem. 2021 Apr;47(2):365-380. doi: 10.1007/s10695-020-00918-1. Epub 2021 Jan 3. Fish Physiol Biochem. 2021. PMID: 33389354 Free PMC article.
Cited by
-
Chlorogenic Acid Plays an Important Role in Improving the Growth and Antioxidant Status and Weakening the Inflammatory Response of Largemouth Bass (Micropterus salmoides).Animals (Basel). 2024 Oct 5;14(19):2871. doi: 10.3390/ani14192871. Animals (Basel). 2024. PMID: 39409820 Free PMC article.
-
Dietary inulin supplementation improves meat quality and off-flavor of duck meat referring to regulated muscle fiber types and antioxidant capacity.Food Chem X. 2024 Dec 30;25:102148. doi: 10.1016/j.fochx.2024.102148. eCollection 2025 Jan. Food Chem X. 2024. PMID: 39844955 Free PMC article.
References
-
- FAO. World fisheries and aquaculture. Rome: FAO; 2022.
-
- Lokesh J, Ghislain M, Reyrolle M, Le Bechec M, Pigot T, Terrier F, et al. Prebiotics modify host metabolism in rainbow trout (Oncorhynchus mykiss) fed with a total plant-based diet: potential implications for microbiome-mediated diet optimization. Aquaculture. 2022;561:738699. doi: 10.1016/j.aquaculture.2022.738699. - DOI
-
- Lokesh J, Delaygues M, Defaix R, Le Bechec M, Pigot T, Dupont Nivet M, et al. Interaction between genetics and inulin affects host metabolism in rainbow trout fed a sustainable all plant-based diet. Br J Nutr. 2023;130(7):1105–20. - PubMed
-
- Desai AR, Links MG, Collins SA, Mansfield GS, Drew MD, Van Kessel AG, et al. Effects of plant-based diets on the distal gut microbiome of rainbow trout (Oncorhynchus mykiss) Aquaculture. 2012;350–353:134–142. doi: 10.1016/j.aquaculture.2012.04.005. - DOI
-
- Véron V, Panserat S, Le Boucher R, Labbé L, Quillet E, Dupont-Nivet M, et al. Long-term feeding a plant-based diet devoid of marine ingredients strongly affects certain key metabolic enzymes in the rainbow trout liver. Fish Physiol Biochem. 2016;42:771–785. doi: 10.1007/s10695-015-0174-2. - DOI - PubMed
LinkOut - more resources
Full Text Sources
