. 2024 Apr;11(13):e2308750.
doi: 10.1002/advs.202308750. Epub 2024 Jan 21.

Protozoan-Derived Cytokine-Transgenic Macrophages Reverse Hepatic Fibrosis

Affiliations

Protozoan-Derived Cytokine-Transgenic Macrophages Reverse Hepatic Fibrosis

Ying Chen et al. Adv Sci (Weinh). 2024 Apr.

Abstract

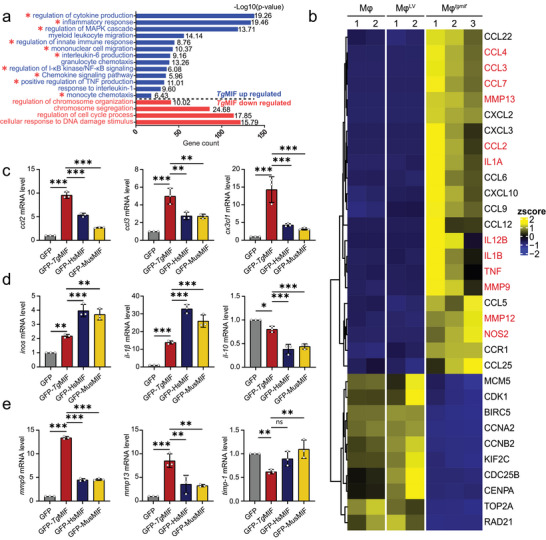
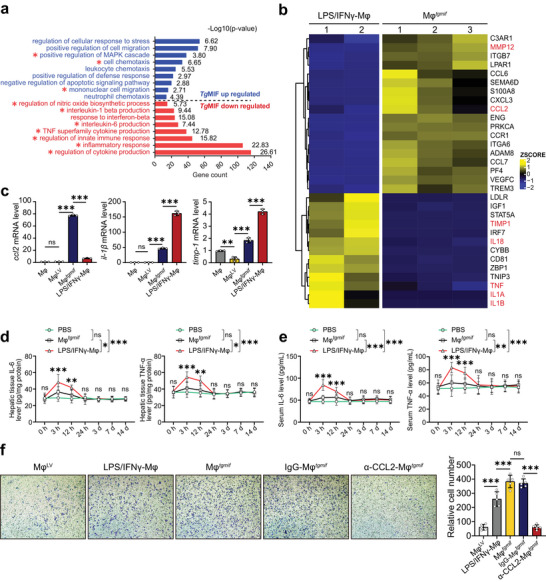
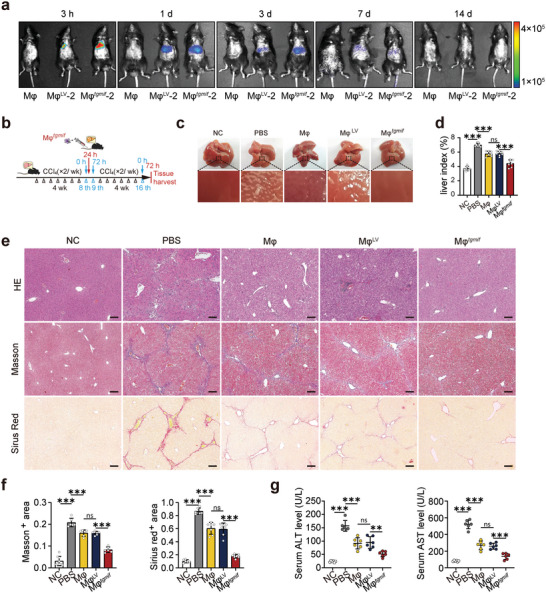
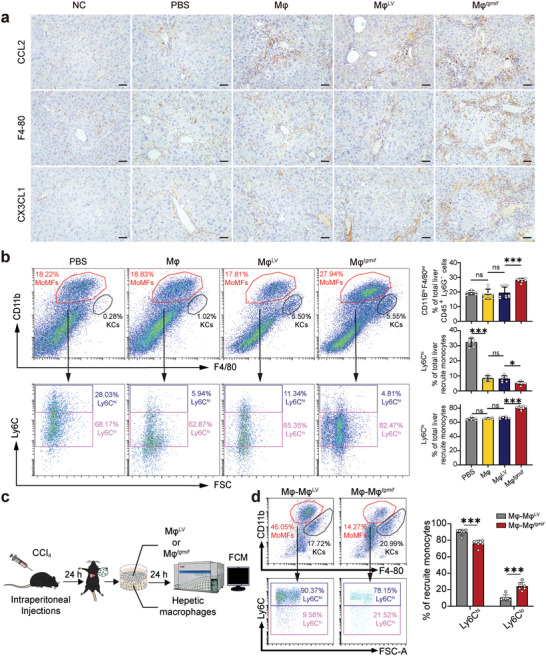
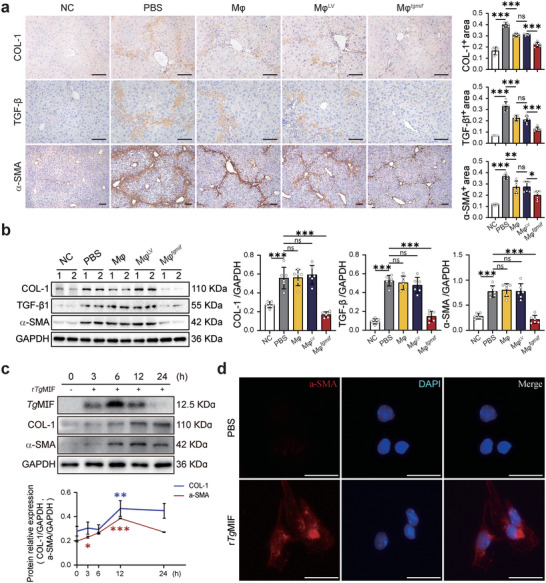
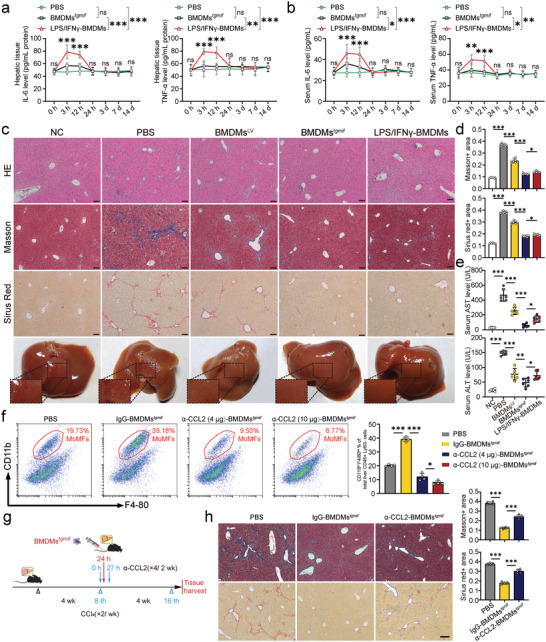
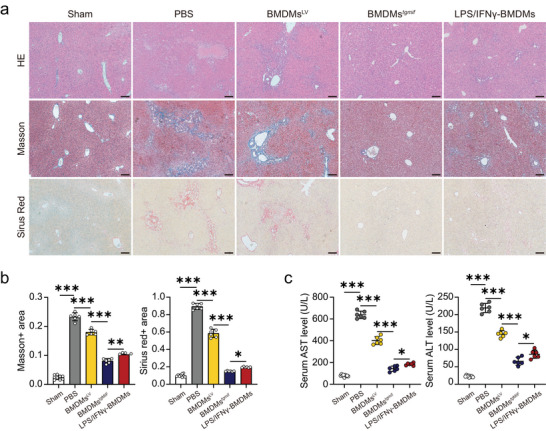
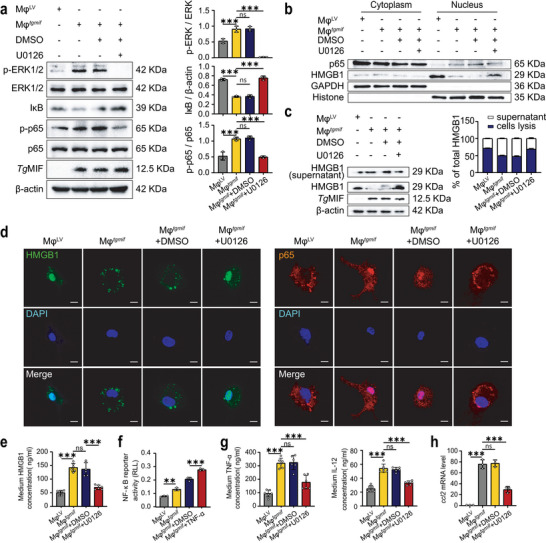
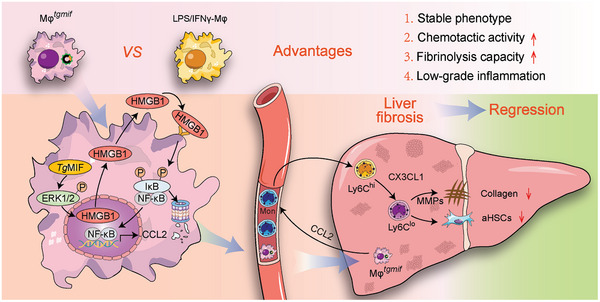
Macrophage therapy for liver fibrosis is on the cusp of meaningful clinical utility. Due to the heterogeneities of macrophages, it is urgent to develop safer macrophages with a more stable and defined phenotype for the treatment of liver fibrosis. Herein, a new macrophage-based immunotherapy using macrophages stably expressing a pivotal cytokine from Toxoplasma gondii, a parasite that infects ≈ 2 billion people is developed. It is found that Toxoplasma gondii macrophage migration inhibitory factor-transgenic macrophage (Mφtgmif) shows stable fibrinolysis and strong chemotactic capacity. Mφtgmif effectively ameliorates liver fibrosis and deactivates aHSCs by recruiting Ly6Chi macrophages via paracrine CCL2 and polarizing them into the restorative Ly6Clo macrophage through the secretion of CX3CL1. Remarkably, Mφtgmif exhibits even higher chemotactic potential, lower grade of inflammation, and better therapeutic effects than LPS/IFN-γ-treated macrophages, making macrophage-based immune therapy more efficient and safer. Mechanistically, TgMIF promotes CCL2 expression by activating the ERK/HMGB1/NF-κB pathway, and this event is associated with recruiting endogenous macrophages into the fibrosis liver. The findings do not merely identify viable immunotherapy for liver fibrosis but also suggest a therapeutic strategy based on the evolutionarily designed immunomodulator to treat human diseases by modifying the immune microenvironment.

Keywords: Toxoplasma gondii; Toxoplasma gondii macrophage migration inhibitory factors; immunotherapy; liver fibrosis; macrophages; polarization.


Conflict of interest statement

The authors declare no conflict of interests.

Figures

Figure 1
Figure 1
The phenotype of TgMIF‐induced macrophages. a) Gene Ontology (GO) enrichment bar plot for differentially expressed genes between the MφLV and Mφ tgmif groups. The pathways for genes upregulated in Mφ tgmif shown in blue, while the pathways for downregulated genes are shown in red. The ‐log10 (p value) was also displayed in each bar. b) Heatmap for representative differentially expressed genes across RAW264.7 (Mφ), Mφ tgmif , and MφLV cells with biological replicates. The gene expression level was normalized by the z score. Color toward yellow indicates upregulation, and blue indicates downregulation. The significantly differentially expressed genes are marked in red. c–e) GFP, GFP‐TgMIF, GFP‐MusMIF, or GFP‐HsMIF were transfected into RAW264.7 respectively. The relative expression levels of the indicated mRNAs were analyzed by qRT‐PCR (n = 3 per group). Results were analyzed using one‐way ANOVA. Bars = mean ± SD. *p < 0.05, **p < 0.01, ***p < 0.001 and ns, not statistically significant.
Figure 2
Figure 2
TgMIF promotes macrophages with high chemotactic capacity and low‐grade inflammation compared with those activated by LPS/IFN‐γ. a) GO enrichment bar plot for differentially expressed genes between the Mφ tgmif and LPS/IFN‐γ‐Mφ groups. The pathways for genes upregulated in Mφ tgmif were shown in blue, and the downregulated pathways were shown in red. The ‐log10 (p value) was also displayed in each bar. b) Gene expression heatmap for representative differentially expressed genes across Mφ tgmif and LPS/IFN‐γ‐Mφ with biological replicates. The gene expression level was normalized by the z score. Color toward yellow indicates upregulation, and blue indicates downregulation. Significantly differentially expressed genes are marked in red. c) ccl2, il‐1β, and timp‐1 mRNA expressions were analyzed by qRT‒PCR (n = 3 per group). d,e) Mice were infused with macrophages (2 × 106 per mouse) and sacrificed humanely at the indicated time points after cell injection. PBS was injected as a control. The liver (d) and serum (e) were collected, and the concentrations of the indicated cytokines were determined by ELISA (n = 6 per group). f) C57BL/6 mice received 0.6 mL kg−1 body weight of CCl4 diluted in olive oil by i.p. injection twice per week to induce liver fibrosis. After the 8th CCl4 injection, PBMC were isolated and placed into the upper chamber; medium derived from different groups of macrophages was placed into the lower chamber for 24 h. CCL2‐neutralizing antibody (2 µg mL−1) or control IgG antibody (2 µg mL−1) was added into the medium of Mφ tgmif for 24 h (n = 5). Representative images and statistical analyses are shown (Magnification: 200 ×). Results were analyzed using one‐way ANOVA. Bars = mean ± SD. *p < 0.05, **p < 0.01, ***p < 0.001 and ns, not statistically significant.
Figure 3
Figure 3
tgmif attenuates CCl4‐induced hepatic fibrosis in mice. a) Whole‐body imaging using in vivo imagin system at different time points. Mφ: fibrotic mice received RAW264.7; MφLV‐2: fibrotic mice received the MφLV‐2 stable cell line; Mφ tgmif ‐2: fibrotic mice received the Mφ tgmif ‐2 stable cell line. b. Study design: Mice were infused with 2 × 106 macrophages (diluted in 150 µL PBS) or 150 µL PBS through the tail vein at 24 h post‐8th CCl4 injection. With continual injection with CCl4 for another 4 weeks, mice were sacrificed humanely 3 days after the last injection. c) Representative images of livers. d) The liver index was calculated according to the following formula: liver index (%) = liver weight (g)/body weight (g) × 100 (n = 7 per group). e) Representative histological liver sections with H&E, Masson's trichrome, and Sirius red staining. (×100; Scale bar = 200 µm). f) Positive areas were quantitatively analyzed (n = 6/6/7/7/7 (Sirius red) and n = 9/6/6/6/6 (Masson) per group). g) The serum concentrations of AST and ALT were determined by an automatic biochemical analyzer (n = 6 per group). Results were analyzed using one‐way ANOVA. Bars = mean ± SD. **p < 0.01, ***p < 0.001 and ns, statistically not significant. NC: negative control, mice were treated with an equal amount of pure olive oil; PBS: fibrotic mice receive PBS; Mφ: fibrotic mice received RAW264.7; MφLV: fibrotic mice received MφLV stable cell line; Mφ tgmif : fibrotic mice received Mφ tgmif stable cell line.
Figure 4
Figure 4
tgmif promotes the recruitment of MoMFs and a phenotypic switch to Ly6Clo macrophages. a. The expression of CCL2, F4‐80, and CX3CL1 in livers tested by IHC (×200; Scale bar = 100 µm). b. Hepatic macrophages were isolated 24 h after cell infusion and analyzed by flow cytometry assay. Cells were gated to identify MoMFs (CD45+Ly6GCD11bhiF4/80int) and KCs (CD45+Ly6GCD11bloF4/80hi). Representative flow cytometry density plots of KCs and MoMFs are shown. The corresponding statistical chart is on the right (n = 7/9/9/9 per group). These MoMFs were further divided into pro‐inflammatory MoMFs (Ly6Chi) and restorative MoMFs (Ly6Clo). Representative flow cytometry density plots of subsets (Ly6Chi/lo) are shown. The corresponding statistical chart is on the right (n = 7/6/6/8 per group). c) Following 24 h after CCl4 administration, hepatic macrophages were separated and co‐cultured with either Mφ tgmif or MφLV for 24 h. d) Representative flow cytometry density plots of KCs, MoMFs, and subsets (Ly6Chi/lo) are shown. The corresponding statistical chart is on the right (n = 6 per group). Results were analyzed using one‐way ANOVA. Bars = mean ± SD. **p < 0.01, ***p < 0.001 and ns, not statistically significant. NC: negative control, mice were treated with an equal amount of pure olive oil; PBS: fibrotic mice received PBS; Mφ: fibrotic mice received RAW264.7; MφLV: fibrotic mice received the MφLV stable cell line; Mφ tgmif : fibrotic mice received the Mφ tgmif stable cell line.
Figure 5
Figure 5
tgmif , but not rTgMIF deactivates HSCs.a. Study design was described in Fig 3b. The liver tissue sections were stained with anti‐COL‐1, anti‐TGF‐β or anti‐α‐SMA antibodies for IHC (×200; Scale bar = 200 µm). Positively stained regions were quantitatively analyzed on the right (n = 6 per group (COL‐1); n = 5/6/6/6/6 (TGF‐β) and n = 6/6/6/6/7 (α‐SMA) per group). b. The relative protein expression in liver tissues was detected by Western blot (WB) analysis. Quantification was shown on the right side (n = 6). c. The indicated proteins were detected by WB analysis at 3 h, 6 h, 12 h, and 24 h after rTgMIF (1 µg mL−1) was added to the culture medium of primary mouse HSCs. Quantification is shown in the lower panel (n = 3). d. The expression of α‐SMA in primary mouse HSCs was detected by immunofluorescence (IF) after 24 h of treatment with rTgMIF (Scale bar = 25 µm). Results were analyzed using one‐way ANOVA. Bars = mean ± SD. *p < 0.05, **p < 0.01, ***p < 0.001 and ns, statistically not significant. NC: negative control, mice were treated with an equal amount of pure olive oil; PBS: fibrotic mice received PBS; Mφ: fibrotic mice received RAW264.7; MφLV: fibrotic mice received MφLV stable cell line; Mφ tgmif : fibrotic mice received Mφ tgmif stable cell line.
Figure 6
Figure 6
BMDMs tgmif exhibits better safety profiles and therapeutic effects than LPS/IFN‐γ‐BMDMs in CCl4‐induced liver fibrosis. a,b. Mice were infused with BMDMs (2 × 106 per mouse) and sacrificed humanely at the indicated time points after cell injection. PBS was injected as a control. The concentrations of the indicated cytokines in the liver (a) and serum (b) were determined by ELISA (n = 6 per group). c. Representative liver image, histological liver sections with H&E, Masson's trichrome, and Sirius red staining. (×100; Scale bar = 200 µm). Positive areas were quantitatively analyzed in d (n = 6 per group). e) The concentrations of biochemical indicators of liver function, including serum concentrations of ALT and AST (n = 6 per group). f) Representative flow cytometry density plots of MoMFs are shown following injection of CCL2 neutralizing antibody (4 µg or 10 µg per mouse, i.v.) 3 h after BMDMs tgmif delivery. The corresponding statistical chart is on the right (n = 4 per group). g) Anti‐CCL2 antibody (4 µg per mouse, i.v.) or an equal amount of control antibody (IgG2b) was given to the liver fibrosis mice 3 h after cell infusion, and this procedure was repeated twice a week for two weeks. h) Representative histological liver sections with Masson's trichrome, and Sirius red staining after CCL2 blockade (×100; Scale bar = 200 µm). Positive areas were quantitatively analyzed (n = 6 per group). Results were analyzed using one‐way ANOVA. Bars = mean ± SD. *p < 0.05, **p < 0.01, ***p < 0.001 and ns, statistically not significant. NC: negative control, mice were treated with an equal amount of pure olive oil; PBS: mice received PBS; BMDMsLV: mice received BMDMs overexpressing LV; BMDMs tgmif : mice received BMDMs overexpressing LV‐TgMIF; LPS/IFN‐γ‐BMDMs: mice received BMDMs induced by LPS/IFN‐γ.
Figure 7
Figure 7
TgMIF‐transgenic BMDMs alleviate BDL‐induced liver fibrosis. a) Representative histological liver sections with H&E, Masson's trichrome, and Sirius red staining. (×100; Scale bar = 200 µm). Positive areas were quantitatively analyzed in b) (n = 9/6/6/6/6 per group). c) The concentrations of biochemical indicators of liver function, including serum concentrations of ALT and AST (n = 6 per group). Results were analyzed using one‐way ANOVA. Bars = mean ± SD. *p < 0.05, **p < 0.01, ***p < 0.001 and ns, statistically not significant. Sham: sham‐operated control mice; PBS: mice received PBS; BMDMsLV: mice received BMDMs overexpressing LV; BMDMs tgmif : mice received BMDMs overexpressing LV‐TgMIF; LPS/IFN‐γ‐BMDMs: mice received BMDMs induced by LPS/IFN‐γ.
Figure 8
Figure 8
TgMIF upregulates the expression of CCL2 through the ERK/HMGB1/NF‐κB pathway. a) WB analysis was used to determine the expression of proteins related to the ERK and NF‐κB pathways. Quantification was shown on the right side (n = 3 per group). b) Nuclear and cytoplasmic separation experiments showed the nuclear‐cytoplasmic shift of HMGB1 and p65. c) WB analysis was utilized to detect the level of HMGB1 in the whole cell lysate and cell culture supernatant. Quantification was shown on the right side (n = 3 per group). d) IF showed the nuclear and cytoplasmic translocation of HMGB1 and p65 (Scale bar = 10 µm). e) ELISA detected the secretion of HMGB1 in the supernatant of cell culture (n = 6 per group). f). NF‐κB activation was determined using a luciferase reporter assay (n = 3 per group). g) ELISA was used to detect the secretion of inflammatory factors in the supernatant of cell culture (n = 6 per group). h) ccl2 mRNA expressions were analyzed by qRT‒PCR (n = 3 per group). Results were analyzed using one‐way ANOVA. Bars = mean ± SD. **p < 0.01, ***p < 0.001 and ns, not statistically significant.
Figure 9
Figure 9
tgmif with strong chemotactic capacity and lower grade of inflammation on the usage of liver fibrosis. By activating the ERK/HMGB1/NF‐κB pathway, TgMIF promoted CCL2 expression, which enabled Mφ tgmif to recruit Ly6Chi macrophages into the liver. Subsequently, Mφ tgmif polarized Ly6Chi into the restorative Ly6Clo macrophage through the secretion of CX3CL1, with the overall function of efficiently alleviating liver fibrosis and deactivating aHSCs.

Similar articles

Cited by

References

    1. Collaborators G. B. D. C., Gastroenterol. Hepatol. 2020, 5, 245.
    1. Asrani S. K., Devarbhavi H., Eaton J., Kamath P. S., J. Hepatol. 2019, 70, 151. - PubMed
    1. Schuppan D., Afdhal N. H., Lancet 2008, 371, 838. - PMC - PubMed
    1. Tsochatzis E. A., Bosch J., Burroughs A. K., Lancet 2014, 383, 1749. - PubMed
    1. a) Forbes S. J., Gupta S., Dhawan A., J. Hepatol. 2015, 62, S157; - PubMed
    2. b) Campana L., Esser H., Huch M., Forbes S., Nat. Rev. Mol. Cell Biol. 2021, 22, 608. - PubMed