Review
. 2024 Mar;46(3):e2300188.
doi: 10.1002/bies.202300188. Epub 2024 Jan 21.

Design patterns of biological cells

Affiliations
Review

Design patterns of biological cells

Steven S Andrews et al. Bioessays. 2024 Mar.

Abstract

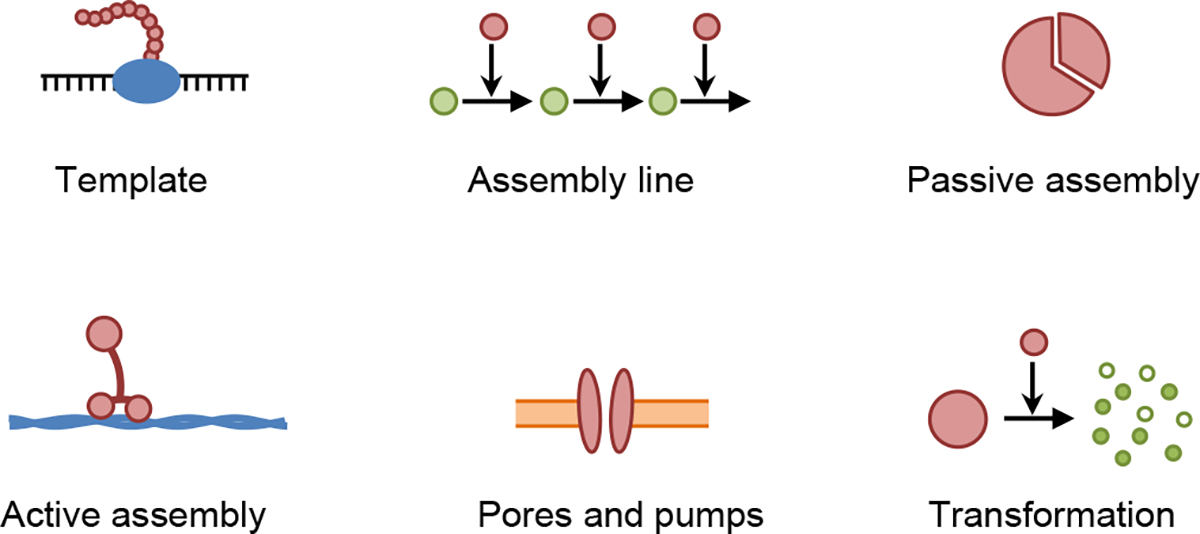
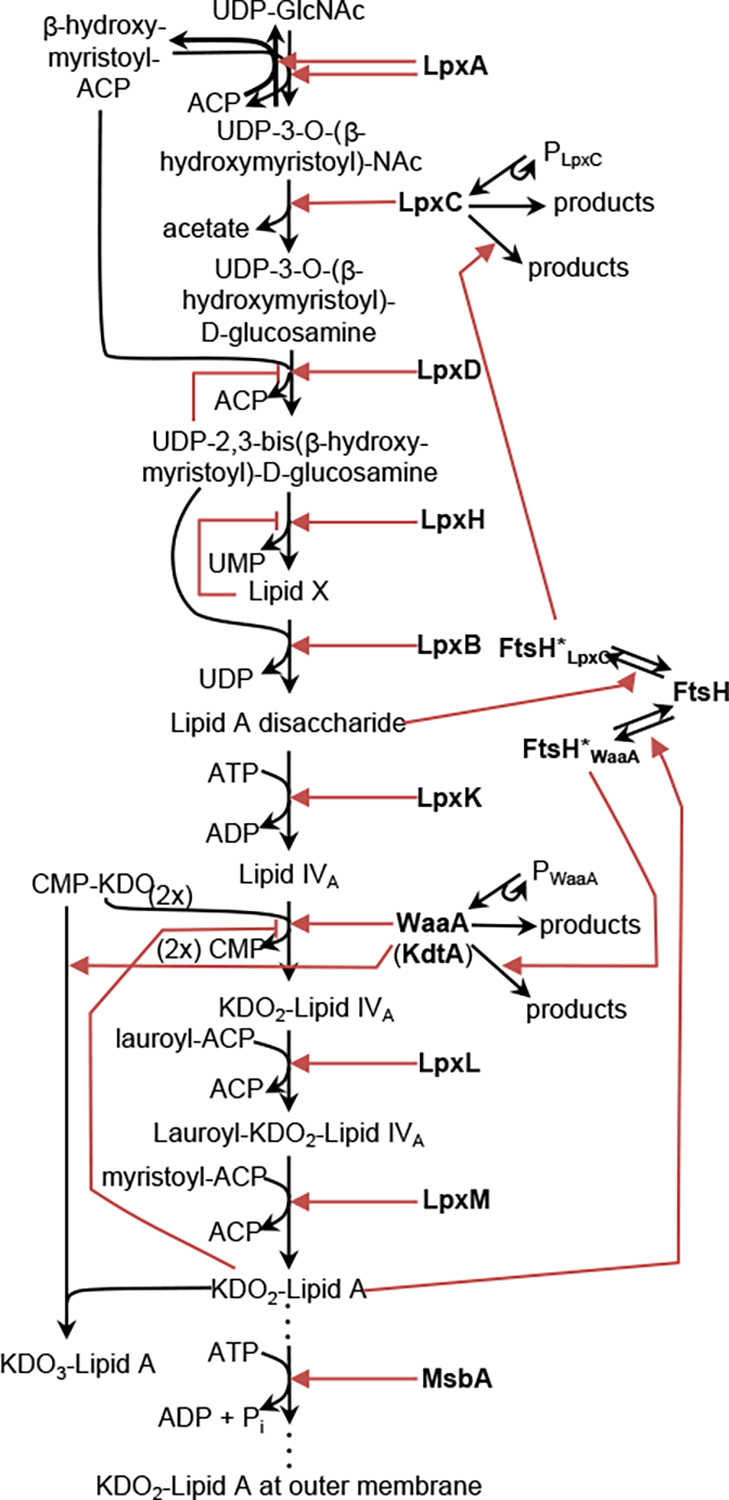
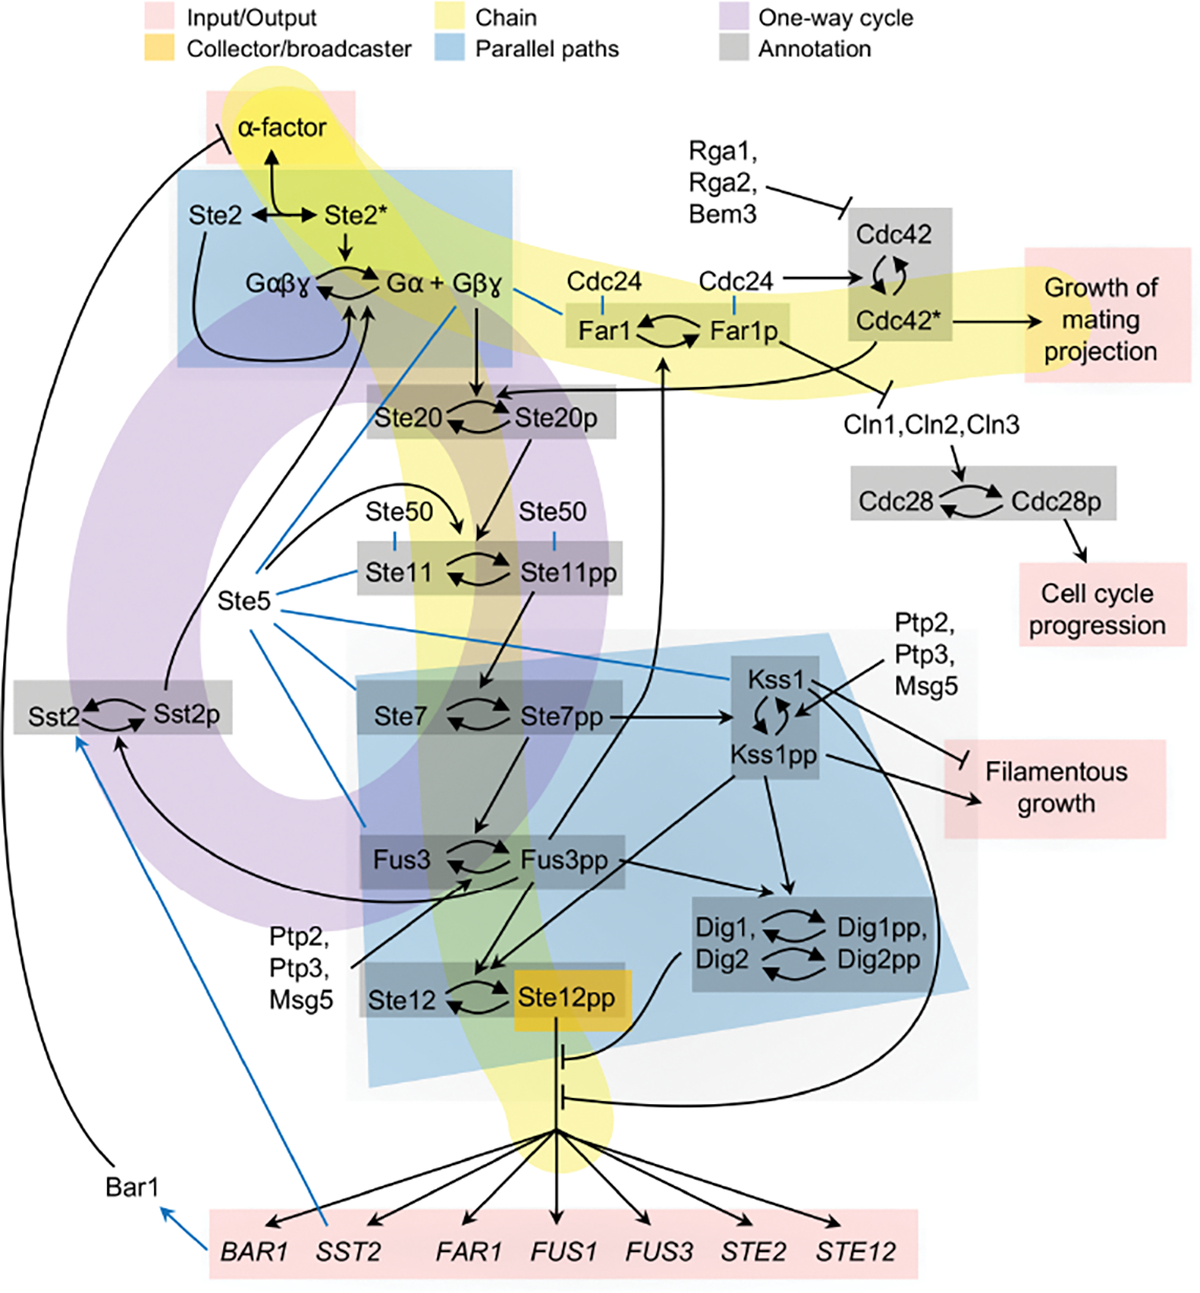
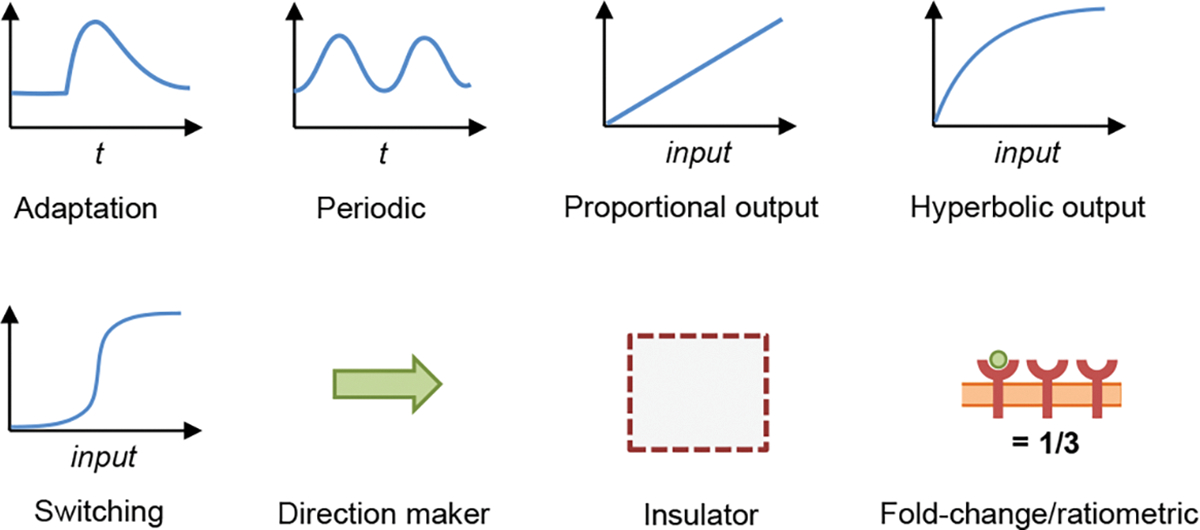
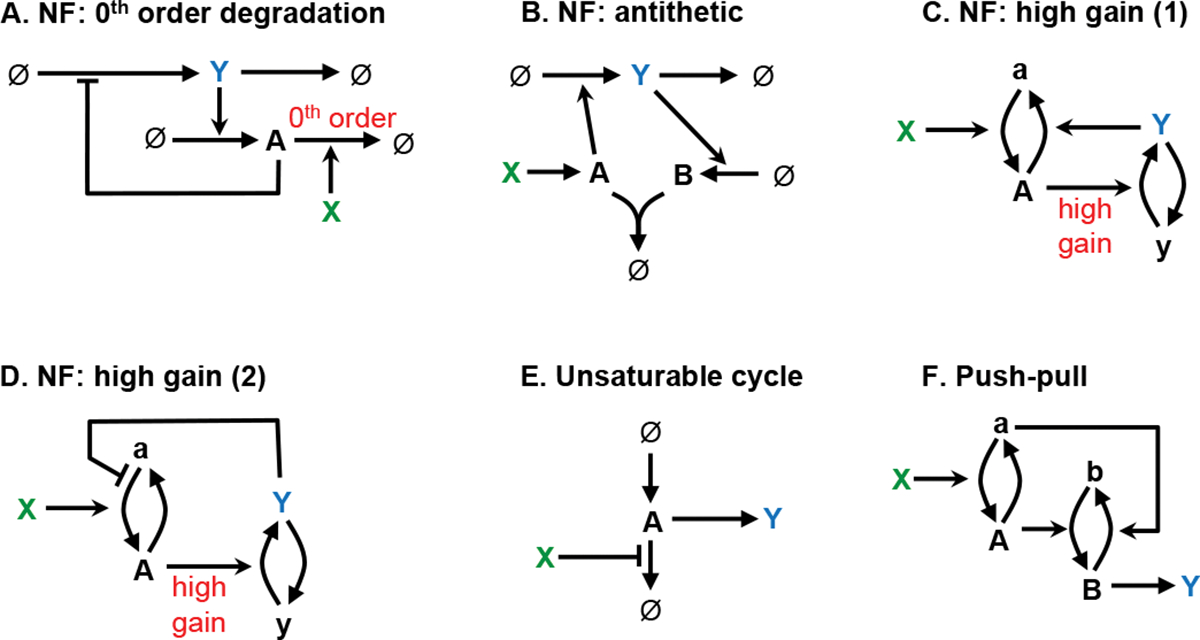
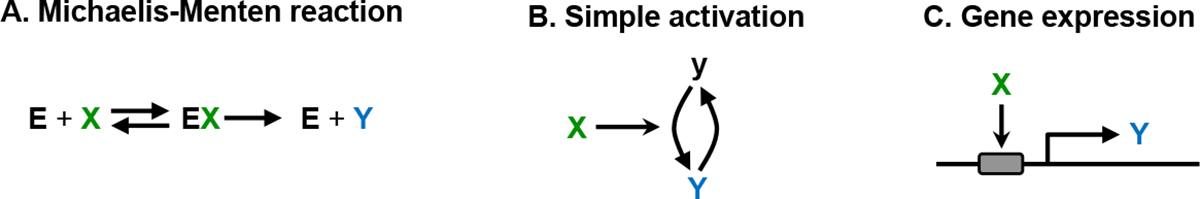
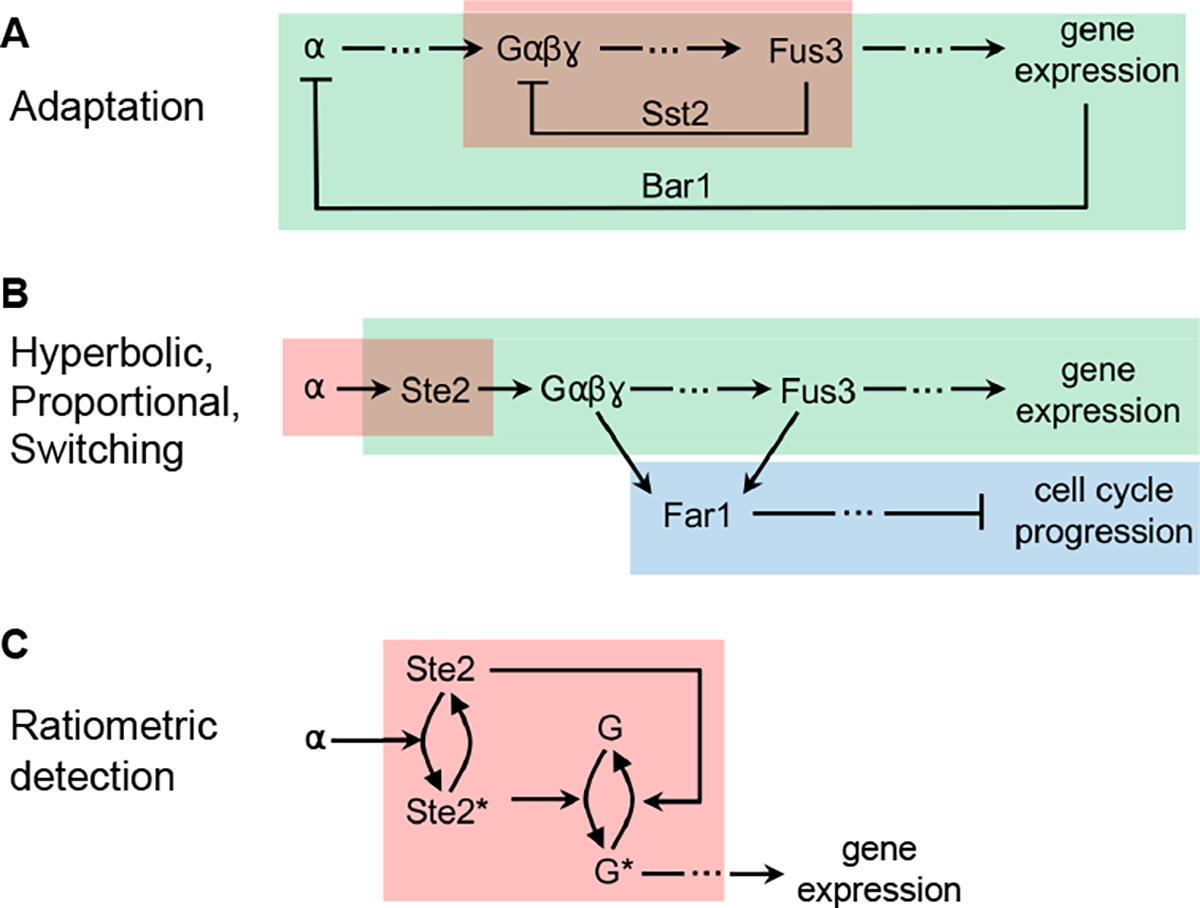
Design patterns are generalized solutions to frequently recurring problems. They were initially developed by architects and computer scientists to create a higher level of abstraction for their designs. Here, we extend these concepts to cell biology to lend a new perspective on the evolved designs of cells' underlying reaction networks. We present a catalog of 21 design patterns divided into three categories: creational patterns describe processes that build the cell, structural patterns describe the layouts of reaction networks, and behavioral patterns describe reaction network function. Applying this pattern language to the E. coli central metabolic reaction network, the yeast pheromone response signaling network, and other examples lends new insights into these systems.

Keywords: cell biology modeling; cell signaling; metabolism; systems biology.


Figures

Fig. 1
Fig. 1
Cartoons of creational patterns, each of which represents an iconic example of the given pattern.
Fig. 2
Fig. 2
Example of an Assembly Line pattern. This is the E. coli biosynthesis pathway for lipopolysaccharide. Black arrows represent chemical reactions in which reactants are converted to products. Red arrows represent enzymatic or other influences on reaction rates, using pointed arrowheads for positive influences and bar arrowheads for negative influences. Figure modified with permission from ref. [20].
Fig. 3
Fig. 3
Cartoons of structural patterns, with each one representing an iconic example of the given pattern.
Fig. 4
Fig. 4
The central metabolic system for E. coli with highlighted regions showing several structural patterns. The metabolic map is reprinted with permission from ref. [54].
Fig. 5
Fig. 5
Diagram of the Saccharomyces cerivisiae pheromone response signaling pathway. This diagram was created from information described in refs. [–59].
Fig. 6
Fig. 6
Cartoons of behavioral patterns, with each one representing an iconic example of the given pattern.
Fig. 7
Fig. 7
Adaptation design pattern, showing two mechanisms for robust perfect adaptation. In each, X is the input and Y exhibits perfect adaptation to variation in X. (A) Zeroth order degradation mechanism, in which the integral is stored in A. (B) Antithetic mechanism, in which the integral is stored in the concentration difference BA. (C) Simulation of the antithetic mechanism. Here, all species start at concentration 1, X increases to 3 at t=0, and Y is perturbed but then adapts. Details: kA is zeroth order, ky is first order, and kY,kB, and kab are second order; kY=ky=kA=ka=kab=1.
Fig. 8
Fig. 8
Periodic design pattern, showing feedback oscillators in the top row and relaxation oscillators in the bottom row. Graphs in panels C and F show the repressilator and relaxation oscillator 1, respectively. Details: each node was represented by production and destruction reactions, e.g. kAAka, with activations promoting the production reactions using first order kinetics and repressions promoting the destruction reactions with Michaelis-Menten kinetics (e.g. KA is the Michaelis constant for repression at node A). All species started with concentration 1. For panel C, kA=2 and kB=kC=ka=kb=kc=KA=KB=KC=1. For panel F,kA=1.1,ka=kB=1, and kb=0.5.
Fig. 9
Fig. 9
Mechanisms for the Proportional output design pattern. In all cases, X is the input and the steady-state concentration of Y increases in direct proportion to X. “NF” stands for negative feedback.
Fig. 10
Fig. 10
Some mechanisms that produce the Hyperbolic output design pattern. In each panel, Y responds with hyperbolic dependence on X.
Fig. 11
Fig. 11
Mechanisms for the Switching design pattern. In each panel, X is the input and Y is the output.
Fig. 12
Fig. 12
Diagram of the yeast signaling reaction network. Black arrows with solid head represent chemical reactions, black arrows with barbed and T-bar points represent activations and inhibitions, blue arrows represent gene expression, and blue lines represent binding.
Fig. 13
Fig. 13
Several behavioral patterns in the yeast pheromone response signaling reaction network. (A) Both boxes represent the Adaptation pattern. (B) The red box represents Hyperbolic output, green represents Proportional output, and blue represents Switching output. (C) The box represents Ratiometric detection.

Update of

Similar articles

Cited by

References

    1. Alexander C: The pattern of streets. Journal of the American Institute of Planners 32(5), 273–278 (1966)
    1. Alexander C, Ishikawa S, Silverstein M, Jacobson M, Fiksdahl-King I, Angel S: A Pattern Language: Towns, Buildings, Construction. Oxford university press, New York: (1977)
    1. Alexander C: The Timeless Way of Building. Oxford university press, New York: (1979)
    1. Gamma E, Johnson R, Helm R, Johnson RE, Vlissides J: Design Patterns: Elements of Reusable Object-oriented Software. Addison-Wesley, New York: (1995)
    1. McAdams HH, Shapiro L: Circuit simulation of genetic networks. Science 269(5224), 650–656 (1995) - PubMed

MeSH terms

LinkOut - more resources