. 2023 Dec 22;13(1):30.
doi: 10.3390/antiox13010030.

T3 Intratracheal Therapy Alleviates Pulmonary Pathology in an Elastase-Induced Emphysema-Dominant COPD Mouse Model

Affiliations

T3 Intratracheal Therapy Alleviates Pulmonary Pathology in an Elastase-Induced Emphysema-Dominant COPD Mouse Model

Noriki Takahashi et al. Antioxidants (Basel). .

Abstract

Chronic obstructive pulmonary disease (COPD) is a complex pulmonary condition characterized by bronchitis, emphysema, and mucus stasis. Due to the variability in symptoms among patients, traditional approaches to treating COPD as a singular disease are limited. This led us to focus on phenotype/endotype classifications. In this study, we explore the potential therapeutic role of thyroid hormone (T3) by using mouse models: emphysema-dominant elastase-induced COPD and airway-dominant C57BL/6-βENaC-Tg to represent different types of the disease. Here, we showed that intratracheal T3 treatment (40, 80 μg/kg, i.t., every other day) resulted in significant improvements regarding emphysema and the enhancement of respiratory function in the elastase-induced COPD model. T3-dependent improvement is likely linked to the up-regulation of Ppargc1a, a master regulator of mitochondrial biogenesis, and Gclm, a factor associated with oxidative stress. Conversely, neither short- nor long-term T3 treatments improved COPD pathology in the C57BL/6-βENaC-Tg mice. Because the up-regulation of extrathyroidal T3-producing enzyme Dio2, which is also considered a marker of T3 requirement, was specifically observed in elastase-induced COPD lungs, these results demonstrate that exogenous T3 supplementation may have therapeutic potential for acute but not chronic COPD exacerbation. Moreover, this study highlights the relevance of considering not only COPD phenotypes but also COPD endotypes (expression levels of Ppargc1a and/or Dio2) in the research and development of better treatment approaches for COPD.

Keywords: antioxidant effect; chronic obstructive pulmonary disease (COPD); disease type classification; mitochondrial function; pulmo-modulatory factors; thyroid hormone (T3).


Conflict of interest statement

The authors declare no conflict of interest.

Figures
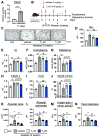
Figure 1
Figure 1
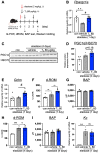
The effect of the intratracheal administration of T3 on the pulmonary pathology of COPD model mice. (A) The relative quantity of Dio2 mRNA in the lungs of the control (white column and closed circle, n = 3) and elastase-induced COPD model mice (grey column and closed triangle, n = 4) (1 day after elastase administration) was measured with RT-qPCR. Data are means ± SEM ** p < 0.01 for Student’s t-test. (B) The experimental scheme of the intratracheal administration of T3 to elastase-induced COPD model mice. (C,D) Morphometric analysis of lungs in the control (white column and closed circle, n = 4), elastase-treated (grey column and closed triangle, n = 7), and intratracheally T3-administrated mice (40 μg/kg: light blue column and closed diamond; 80 μg/kg: blue column and closed square; n = 7–8, every other day for 3 weeks starting 1 day after elastase treatment) using MLI, as described in Methods. (EJ) Respiratory parameters of representative mice were analyzed with the flexiVent system. (KN) Morphological alveolar parameters, such as alveolar area, alveolar perimeter, (major axis + minor axis)/2, and ferret diameter, were measured using an all-in-one fluorescence microscope—BZ-X710—and an automatic cell count system, as well as a BZ-analyzer in the representative mice. Data are means ± SEM * p < 0.05, ** p < 0.01 (vs. control), # p < 0.05, ## p < 0.01 (vs. elastase-vehicle): ANOVA with the Tukey–Kramer procedure.
Figure 2
Figure 2
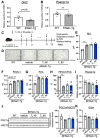
The mechanism of COPD improvement via T3 in elastase-induced COPD model mice. (A) The experimental scheme of the intratracheal administration of T3 into elastase-induced COPD model mice and the analysis performed. (B,E,J) The relative quantity of mRNA levels of Ppargc1a, Gclm, and Kc was measured in the lungs of the control, elastase-treated, and intratracheally T3-administered mice (80 μg/kg, one injection after 1 day of elastase treatment). (C,D) The protein expression levels of PGC1α in the lungs of the control, elastase-treated, and intratracheally T3-administered mice (80 μg/kg, every other day for 4 days after 1 day of elastase treatment) were assessed by immunoblotting. HSC70 was used as the loading control. The band intensity was quantified by using Multi Gauge software (FUJIFILM, Tokyo, Japan). (FI) Oxidative stress and the antioxidant capacity were quantified via d-ROM and BAP tests, respectively, in the plasma of the control, elastase-treated, and intratracheally T3-administered mice (80 μg/kg, one injection 1 day after elastase treatment (F,G) or every other day for 4 days starting 1 day after elastase treatment (H,I)). White column and closed circle represent the control group, grey column and closed triangle represent elastase-treated control group, and blue column and closed square represent T3-administered mice with elastase-treated group. Data are means ± SEM; n = 4–7 mice/group. p values were assessed using ANOVA with the Tukey–Kramer procedure. ** p < 0.01 (vs. control), # p < 0.05 (vs. elastase-vehicle), ns: not significant. The effect size, d, was defined by Cohen’s calculation formula [24].
Figure 3
Figure 3
The effect of the intratracheal administration of T3 on the pulmonary pathology of C57BL/6J-βENaC-Tg mice. (A,B) The relative quantity of mRNA levels of DIo2 and Ppargc1a was measured in the lungs of WT (white column and closed circle, n = 5) and C57BL/6J-βENaC-Tg mice (grey column and closed triangle, n = 5) with RT-qPCR. Data are means ± SEM for Student’s t-test. ns: not significant. (C) The experimental scheme of the intratracheal administration of T3 to C57BL/6J-βENaC-Tg mice. (D,E) Morphometric analysis of WT (white column and closed circle, n = 5), C57BL/6J-βENaC-Tg mice (grey column and closed triangle, n = 5), and intratracheally T3-administrated C57BL/6J-βENaC-Tg mice (40 μg/kg: light blue column and closed diamond; 80 μg/kg: blue column and closed square; n = 5, 40 or 80 μg/kg every other day for 12 days at 13-weeks-old) using MLI. (FH) The respiratory parameters (FEV0.1, FVC, and FEV0.1/FVC) of the representative mice were analyzed using the flexiVent system. (I,K) The relative quantity of mRNA levels of Ppargc1a and Gclm was measured in the lungs of the representative mice using RT-qPCR. (J) The protein expression levels of PGC1α in the lungs of the representative mice were analyzed using immunoblotting (upper panel). HSC70 was used as the loading control. The band intensity was quantified by Multi Gauge software (FUJIFILM, Tokyo, Japan) (lower panel). Data are means ± SEM, ** p < 0.01 (vs. WT) using ANOVA with Tukey–Kramer procedure.
Figure 4
Figure 4
The effect of longer time span intratracheal administration of T3 on pulmonary pathology in C57BL/6J-βENaC-Tg mice. (A) The experimental scheme of the intratracheal administration of T3 into C57BL/6J-βENaC-Tg mice. (B,C) Morphometric analysis of WT (white column and closed circle, n = 5), βENaC-Tg mice (grey column and closed triangle, n = 5), and intratracheally T3-administrated C57BL/6J-βENaC-Tg mice (40 μg/kg: light blue column and closed diamond; 80 μg/kg: blue column and closed square; n = 5, 40 or 80 μg/kg every other day for 2 months at 13-weeks-old) using MLI. (DF) Respiratory parameters (FEV0.1, FVC, FEV0.1/FVC) of representative mice were analyzed using the flexiVent system. (G,I) The relative quantity of mRNA levels of Ppargc1a and Gclm were measured in the lungs of the representative mice using RT-qPCR. (H) The protein expression levels of PGC1α in the lungs of the representative mice were analyzed by immunoblotting (upper panel). HSC70 was used as the loading control. The band intensity was quantified by Multi Gauge software (FUJIFILM, Tokyo, Japan) (lower panel). Data are means ± SEM from ANOVA using the Tukey–Kramer procedure.

References

    1. Rabe K.F., Watz H. Chronic obstructive pulmonary disease. Lancet. 2017;389:1931–1940. doi: 10.1016/S0140-6736(17)31222-9. - DOI - PubMed
    1. Agustí A., Hogg J.C. Update on the Pathogenesis of Chronic Obstructive Pulmonary Disease. N. Engl. J. Med. 2019;381:1248–1256. doi: 10.1056/NEJMra1900475. - DOI - PubMed
    1. Barnes P.J. Small Airways in COPD. N. Engl. J. Med. 2004;350:2635–2637. doi: 10.1056/NEJMp048102. - DOI - PubMed
    1. Hansel N.N., McCormack M.C., Kim V. The Effects of Air Pollution and Temperature on COPD. COPD J. Chronic Obstr. Pulm. Dis. 2016;13:372–379. doi: 10.3109/15412555.2015.1089846. - DOI - PMC - PubMed
    1. Marsh S.E., Travers J., Weatherall M., Williams M.V., Aldington S., Shirtcliffe P.M., Hansell A.L., Nowitz M.R., McNaughton A.A., Soriano J.B., et al. Proportional classifications of COPD phenotypes. Thorax. 2008;63:761–767. doi: 10.1136/thx.2007.089193. - DOI - PMC - PubMed