. 2023 Dec 28;13(1):51.
doi: 10.3390/antiox13010051.

H2S-Synthesizing Enzymes Are Putative Determinants in Lung Cancer Management toward Personalized Medicine

Affiliations

H2S-Synthesizing Enzymes Are Putative Determinants in Lung Cancer Management toward Personalized Medicine

Ana Hipólito et al. Antioxidants (Basel). .

Abstract

Lung cancer is a lethal disease with no truly efficient therapeutic management despite the progresses, and metabolic profiling can be a way of stratifying patients who may benefit from new therapies. The present study is dedicated to profiling cysteine metabolic pathways in NSCLC cell lines and tumor samples. This was carried out by analyzing hydrogen sulfide (H2S) and ATP levels, examining mRNA and protein expression patterns of cysteine catabolic enzymes and transporters, and conducting metabolomics analysis using nuclear magnetic resonance (NMR) spectroscopy. Selenium-chrysin (SeChry) was tested as a therapeutic alternative with the aim of having an effect on cysteine catabolism and showed promising results. NSCLC cell lines presented different cysteine metabolic patterns, with A549 and H292 presenting a higher reliance on cystathionine β-synthase (CBS) and cystathionine γ-lyase (CSE) to maintain H2S levels, while the PC-9 cell line presented an adaptive behavior based on the use of mercaptopyruvate sulfurtransferase (MST) and cysteine dioxygenase (CDO1), both contributing to the role of cysteine as a pyruvate source. The analyses of human lung tumor samples corroborated this variability in profiles, meaning that the expression of certain genes may be informative in defining prognosis and new targets. Heterogeneity points out individual profiles, and the identification of new targets among metabolic players is a step forward in cancer management toward personalized medicine.

Keywords: 3-mercaptopyruvate sulfurtransferase (MST); NSCLC metabolism; cystathionine β-synthase (CBS); cystathionine γ-lyase (CSE); cysteine dioxygenase (CDO1); cysteine metabolism; metabolic plasticity; metabolism-based therapies.


Conflict of interest statement

The authors declare no conflict of interest.

Figures

Figure 1
Figure 1
NSCLC cell lines present cysteine reliance on H2S production. (A) NSCLC cell lines showed similar basal levels of H2S production. To verify if H2S production was directly dependent on cysteine degradation, cells were exposed to AOAA/PAG treatment. (B) NSCLC cells cultured in the presence of the H2S donor NaHS alone and in combination with cysteine showed that H2S levels decreased when exposed to AOAA and PAG. Upon cysteine treatment, PC-9 showed a tendency to decrease the average levels of H2S in control conditions and compensated production of H2S upon exposure to inhibitors. (C) Upon cysteine supplementation, NSCLC cell lines tended to decrease H2S production at T = 0 h but compensated the CBS and CSE inhibition, maintaining (H292 and PC-9) or increasing (A549) H2S levels upon AOAA and PAG exposure. Analysis of H2S at T = 0 h indicated that A549 and H292 cell lines presented decreased levels of H2S in the presence of cysteine with and without glycolysis inhibition with BPA, while the PC-9 cell line presented no significant changes in all conditions. (D) Analysis of H2S levels showed that all cell lines presented a similar basal ability to produce H2S. Maximum score (E) or the average levels (F) of ATP production indicated that A549 cells increased the production of ATP upon cysteine supplementation independently of the presence of inhibitors, while H292 and PC-9 were able to maintain ATP levels in all experimental conditions. Maximum ATP score and average levels indicated that A549 cells increased the levels of ATP upon BPA and/or cysteine supplementation, and H292 and PC-9 cells maintained the ATP levels in all culture conditions independently of glycolysis inhibition. All data were normalized to the control condition and are represented as mean ± SD. * p < 0.5, ** p < 0.01, **** p < 0.0001.
Figure 2
Figure 2
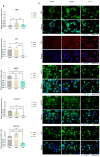
NSCLC cells express distinct expression patterns of enzymes and transporters involved in cysteine metabolism. (A) mRNA expression level analysis showed that H292 cells expressed noteworthy levels of CBS and SLC7A11 compared to A549 cells, while PC-9 cells showed low overall expression of CTH, MPST, SLC1A1, and SLC7A11. (B) Immunofluorescence analysis showed that protein expression followed mRNA expression patterns, reporting similar differences. (C) mRNA expression level analysis further showed that H292 cells highly expressed GOT2, while PC-9 showed high expression levels of GOT2 and CDO1 compared to A549 cells. All mRNA expression level data are relative to HPRT1 and represented as mean ± SD. ** p < 0.01, *** p < 0.001, **** p < 0.0001.
Figure 2
Figure 2
NSCLC cells express distinct expression patterns of enzymes and transporters involved in cysteine metabolism. (A) mRNA expression level analysis showed that H292 cells expressed noteworthy levels of CBS and SLC7A11 compared to A549 cells, while PC-9 cells showed low overall expression of CTH, MPST, SLC1A1, and SLC7A11. (B) Immunofluorescence analysis showed that protein expression followed mRNA expression patterns, reporting similar differences. (C) mRNA expression level analysis further showed that H292 cells highly expressed GOT2, while PC-9 showed high expression levels of GOT2 and CDO1 compared to A549 cells. All mRNA expression level data are relative to HPRT1 and represented as mean ± SD. ** p < 0.01, *** p < 0.001, **** p < 0.0001.
Figure 3
Figure 3
Distinct molecular backgrounds induce individual metabolic patterns in NSCLC cells. (AC) 1H-Nuclear magnetic resonance (NMR) of the NSCLC panel studied indicated alterations between A549, H292, and PC-9 regarding levels of intracellular amino acids and peptides, sugars and organic acids, and other metabolites. (DF) NMR of the NSCLC panel studied further indicated alterations between A549, H292, and PC-9 regarding levels of extracellular amino acids and peptides and sugars and organic acids. Data are represented as mean ± SD. * p < 0.5, ** p < 0.01, *** p < 0.001, **** p < 0.0001. (G,H) PCA showed no differences in the endometabolome (G), but the exometabolome (H) indicated that A549 and PC-9 cells present distinct metabolic profiles, and H292 cells had common metabolic patterns with A549 and PC-9 cells. (I) PLS-DA analysis of the exometabolome allowed the discrimination of the three cell lines. From the PLS-DA analysis of the metabolites present in the cell media, it was possible to discriminate PC-9 from the other cell lines in the first component, while A549 could be discriminated in the second component (upper panel), Q2 = 0.873. (J) The loading plot (lower panel) showing the metabolites important for the discrimination, colored by VIP in the first component. 2-Oxoisocaproate increased in A549, while aspartate, lactate, phosphocholine, and glycerophosphocholine increased in PC-9, making them important for discrimination between these cell lines. (K) From the PLS-DA analysis of the metabolites present in the cell media, it was possible to discriminate between A549 and PC-9 cell lines (upper panel), Q2 = 0.975. (L) The loading plot (lower panel) showing the metabolites important for the discrimination, colored by VIP in the first component. (M) Metabolites significantly different between PC-9 and A549. Volcano plot (fold change >2 and p value < 0.05) of the intracellular metabolites between A549 and PC-9. Arginine, proline, and nicotinurate were significantly increased in A549 and guanosine in PC-9. (N) Nicotinurate was only present in A549 cells. Box plot of nicotinurate intracellular concentrations in the three cell lines (ANOVA analysis p value = 0.00028097 × 10⁴.
Figure 3
Figure 3
Distinct molecular backgrounds induce individual metabolic patterns in NSCLC cells. (AC) 1H-Nuclear magnetic resonance (NMR) of the NSCLC panel studied indicated alterations between A549, H292, and PC-9 regarding levels of intracellular amino acids and peptides, sugars and organic acids, and other metabolites. (DF) NMR of the NSCLC panel studied further indicated alterations between A549, H292, and PC-9 regarding levels of extracellular amino acids and peptides and sugars and organic acids. Data are represented as mean ± SD. * p < 0.5, ** p < 0.01, *** p < 0.001, **** p < 0.0001. (G,H) PCA showed no differences in the endometabolome (G), but the exometabolome (H) indicated that A549 and PC-9 cells present distinct metabolic profiles, and H292 cells had common metabolic patterns with A549 and PC-9 cells. (I) PLS-DA analysis of the exometabolome allowed the discrimination of the three cell lines. From the PLS-DA analysis of the metabolites present in the cell media, it was possible to discriminate PC-9 from the other cell lines in the first component, while A549 could be discriminated in the second component (upper panel), Q2 = 0.873. (J) The loading plot (lower panel) showing the metabolites important for the discrimination, colored by VIP in the first component. 2-Oxoisocaproate increased in A549, while aspartate, lactate, phosphocholine, and glycerophosphocholine increased in PC-9, making them important for discrimination between these cell lines. (K) From the PLS-DA analysis of the metabolites present in the cell media, it was possible to discriminate between A549 and PC-9 cell lines (upper panel), Q2 = 0.975. (L) The loading plot (lower panel) showing the metabolites important for the discrimination, colored by VIP in the first component. (M) Metabolites significantly different between PC-9 and A549. Volcano plot (fold change >2 and p value < 0.05) of the intracellular metabolites between A549 and PC-9. Arginine, proline, and nicotinurate were significantly increased in A549 and guanosine in PC-9. (N) Nicotinurate was only present in A549 cells. Box plot of nicotinurate intracellular concentrations in the three cell lines (ANOVA analysis p value = 0.00028097 × 10⁴.
Figure 4
Figure 4
NSCLC cell lines are chemoresistant, and SeChry@PUREG4-FA induces decreased cell viability in NSCLC cells, with specificity toward tumor cells rather than nontumoral cells. (A) NSCLC cell lines exposed to the most commonly used therapy regimens showed overall resistance to these drugs, except for cisplatin. (B) EC50 curves and values for SeChry, Sechry@PUREG4-FA, and PUREG4-FA in NSCLC indicated a higher sensitivity of A549 and H292 to the treatment than PC-9. Empty nanoparticles (PUREG4.FA) did not induce relevant toxicity on cell viability. (C) EC50 curves and values for SeChry, Sechry@PUREG4-FA, and PUREG4-FA in noncancer cell lines (HaCaT and HK2) indicated no effect on cell viability. Empty nanoparticles (PUREG4.FA) did not induce relevant toxicity on cell viability. (D) Detection of FR-α by immunofluorescence indicated high protein levels in NSCLC but not in nontumoral cell lines. FR- α is labeled in green, and nuclei were counterstained with DAPI (blue). Magnification 400×, scale 20 µm. *** p < 0.001, **** p < 0.0001.
Figure 4
Figure 4
NSCLC cell lines are chemoresistant, and SeChry@PUREG4-FA induces decreased cell viability in NSCLC cells, with specificity toward tumor cells rather than nontumoral cells. (A) NSCLC cell lines exposed to the most commonly used therapy regimens showed overall resistance to these drugs, except for cisplatin. (B) EC50 curves and values for SeChry, Sechry@PUREG4-FA, and PUREG4-FA in NSCLC indicated a higher sensitivity of A549 and H292 to the treatment than PC-9. Empty nanoparticles (PUREG4.FA) did not induce relevant toxicity on cell viability. (C) EC50 curves and values for SeChry, Sechry@PUREG4-FA, and PUREG4-FA in noncancer cell lines (HaCaT and HK2) indicated no effect on cell viability. Empty nanoparticles (PUREG4.FA) did not induce relevant toxicity on cell viability. (D) Detection of FR-α by immunofluorescence indicated high protein levels in NSCLC but not in nontumoral cell lines. FR- α is labeled in green, and nuclei were counterstained with DAPI (blue). Magnification 400×, scale 20 µm. *** p < 0.001, **** p < 0.0001.
Figure 5
Figure 5
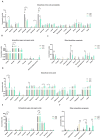
Enzymes and transporters of cysteine metabolism are overexpressed in NSCLC patients. (A) Analysis of mRNA levels showed upregulation of CBS, CTH, GOT1, GOT2, and SLC7A11 and a significant downregulation of SLC1A1 and CDO1 in NSCLC primary tumors of the LUAD TCGA cohort. (B) Analysis of mRNA levels showed upregulation of CBS, GOT1, GOT2, and SLC7A11 and a significant downregulation of SLC1A1 and CDO1 in NSCLC primary tumors of the LUSC TCGA cohort. (C) Analysis of the expression of genes encoding H2S-producing enzymes in the IPOLFG NSCLC cohort indicated that MPST was the most highly expressed gene, GOT1 gene was expressed in higher levels than GOT2, CDO1 gene was detected in most cases, and SLC1A1 and SLC7A11 were expressed in similar levels. (D) CDO1 mRNA expression increased in NSCLC metastatic samples compared to primary tumors. Statistical significance is represented as mean ± SD. *** p < 0.001, **** p < 0.0001.
Figure 5
Figure 5
Enzymes and transporters of cysteine metabolism are overexpressed in NSCLC patients. (A) Analysis of mRNA levels showed upregulation of CBS, CTH, GOT1, GOT2, and SLC7A11 and a significant downregulation of SLC1A1 and CDO1 in NSCLC primary tumors of the LUAD TCGA cohort. (B) Analysis of mRNA levels showed upregulation of CBS, GOT1, GOT2, and SLC7A11 and a significant downregulation of SLC1A1 and CDO1 in NSCLC primary tumors of the LUSC TCGA cohort. (C) Analysis of the expression of genes encoding H2S-producing enzymes in the IPOLFG NSCLC cohort indicated that MPST was the most highly expressed gene, GOT1 gene was expressed in higher levels than GOT2, CDO1 gene was detected in most cases, and SLC1A1 and SLC7A11 were expressed in similar levels. (D) CDO1 mRNA expression increased in NSCLC metastatic samples compared to primary tumors. Statistical significance is represented as mean ± SD. *** p < 0.001, **** p < 0.0001.
Figure 6
Figure 6
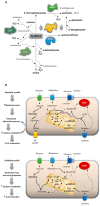
NSCLC subtypes present different metabolic profiles, adjusting their reliance on cysteine. (A) Cysteine catabolic pathways can be divided into pathways of cysteine enzymatic breakdown to produce H2S and organic intermediates mediated by cystathionine β-synthase (CBS), cystathionine γ-lyase (CSE), and/or 3-mercaptopyruvate sulfurtransferase (MST), which work together with cysteine aminotransferase (CAT/GOT), or cysteine oxidative metabolism through cysteine dioxygenase (CDO1). (B) Cysteine metabolism is conditioned by the glucose versus glutamine reliance of cancer cells.

References

    1. Planchard D., Popat S., Kerr K., Novello S., Smit E.F., Faivre-Finn C., Mok T.S., Reck M., Van Schil P.E., Hellmann M.D., et al. Metastatic non-small cell lung cancer: ESMO Clinical Practice Guidelines for diagnosis, treatment and follow-up. Ann. Oncol. Off. J. Eur. Soc. Med. Oncol. 2018;29:iv192–iv237. doi: 10.1093/annonc/mdy275. - DOI - PubMed
    1. Molina J.R., Yang P., Cassivi S.D., Schild S.E., Adjei A.A. Non-small cell lung cancer: Epidemiology, risk factors, treatment, and survivorship. Mayo Clin. Proc. 2008;83:584–594. doi: 10.1016/S0025-6196(11)60735-0. - DOI - PMC - PubMed
    1. Inamura K. Lung Cancer: Understanding Its Molecular Pathology and the 2015 WHO Classification. Front. Oncol. 2017;7:193. doi: 10.3389/fonc.2017.00193. - DOI - PMC - PubMed
    1. Lin J.J., Shaw A.T. Resisting Resistance: Targeted Therapies in Lung Cancer. Trends Cancer. 2016;2:350–364. doi: 10.1016/j.trecan.2016.05.010. - DOI - PMC - PubMed
    1. Esposito L., Conti D., Ailavajhala R., Khalil N., Giordano A. Lung Cancer: Are we up to the Challenge? Curr. Genom. 2010;11:513–518. doi: 10.2174/138920210793175903. - DOI - PMC - PubMed

LinkOut - more resources