. 2023 Dec 28;13(1):53.
doi: 10.3390/antiox13010053.

Vitamin B12 Supplementation Improves Oocyte Development by Modulating Mitochondria and Yolk Protein in a Caffeine-Ingested Caenorhabditis elegans Model

Affiliations

Vitamin B12 Supplementation Improves Oocyte Development by Modulating Mitochondria and Yolk Protein in a Caffeine-Ingested Caenorhabditis elegans Model

Hyemin Min et al. Antioxidants (Basel). .

Abstract

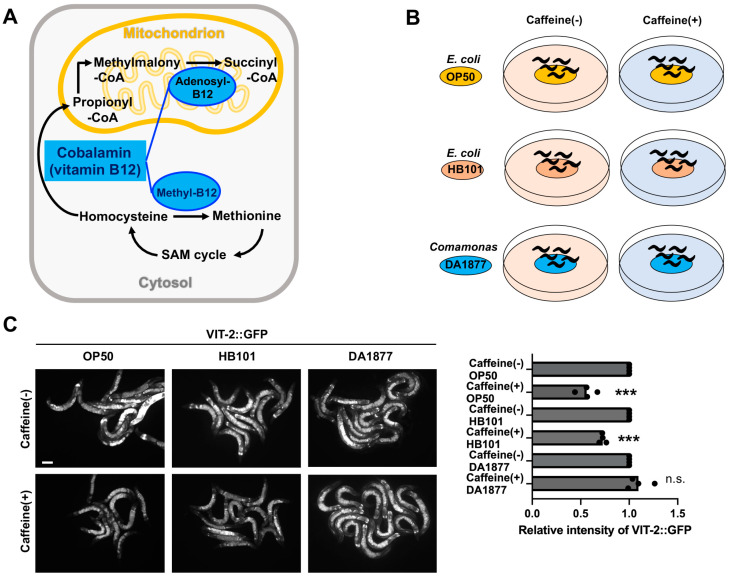
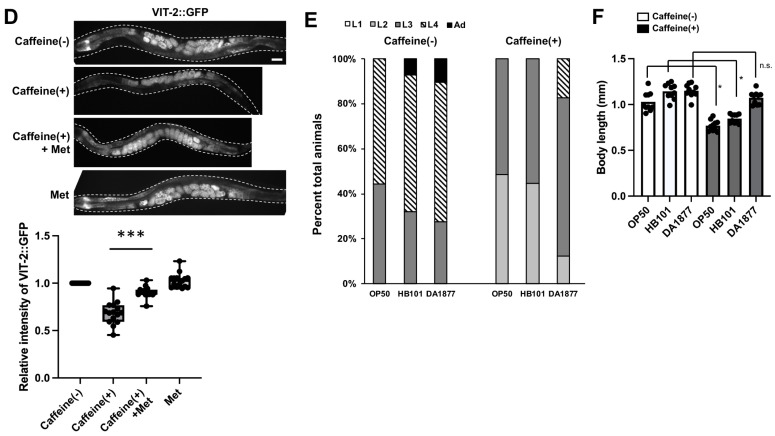
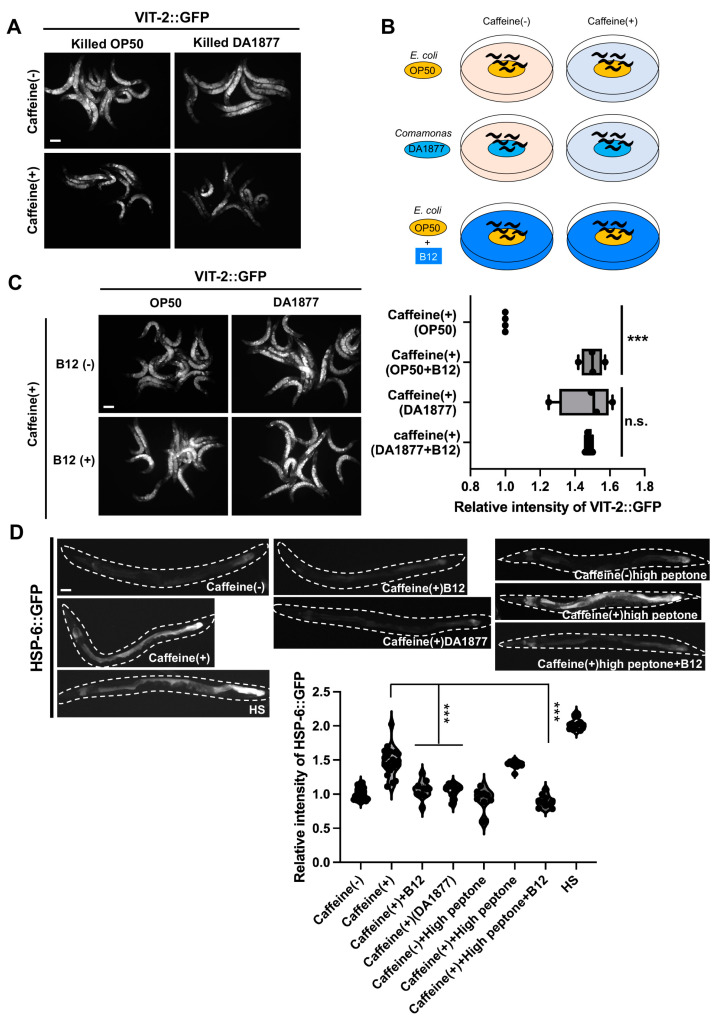
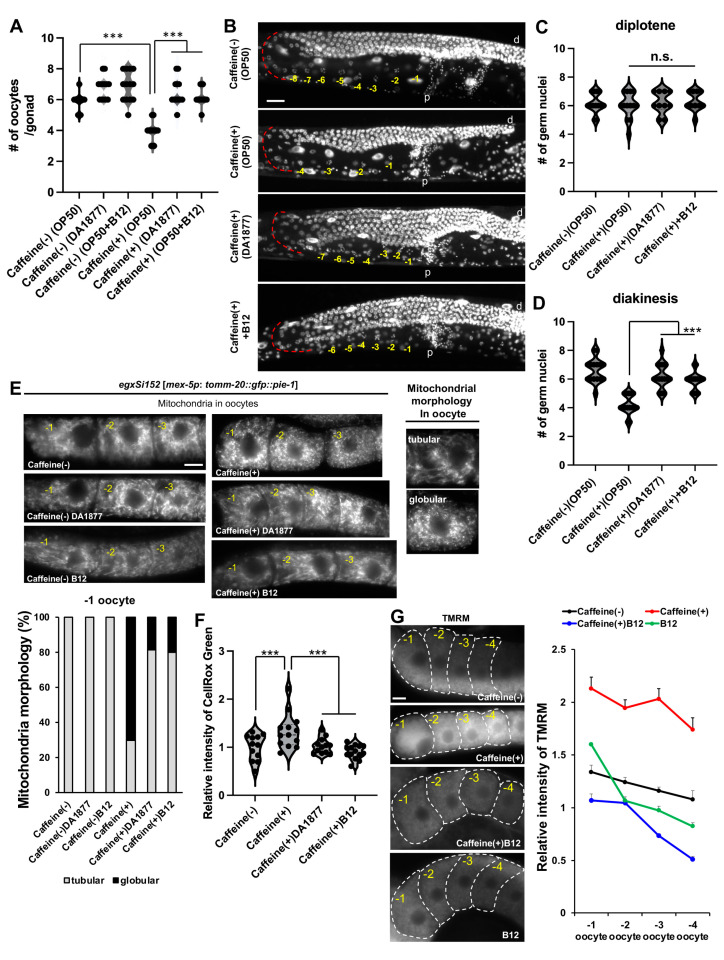
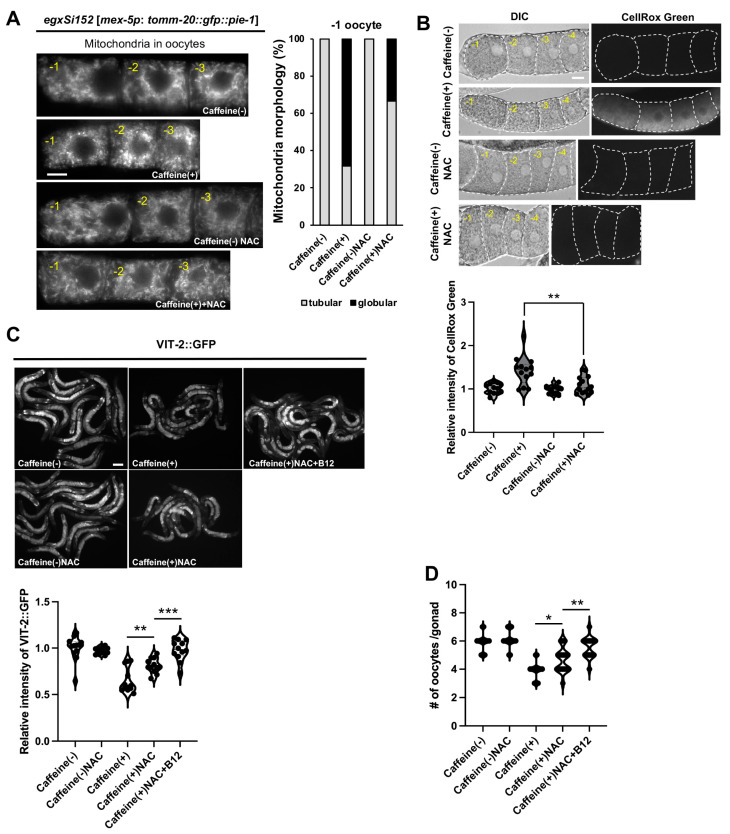
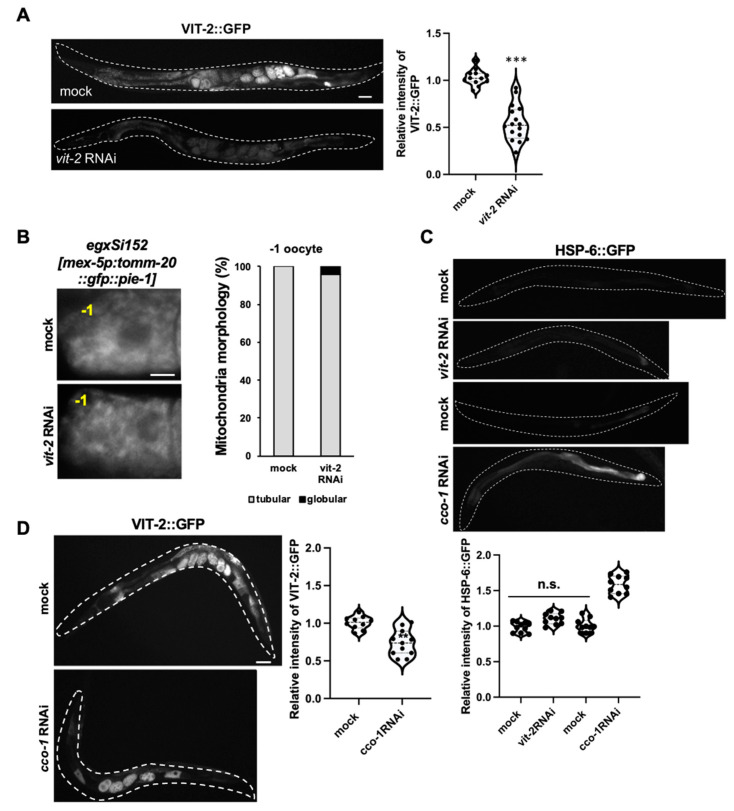
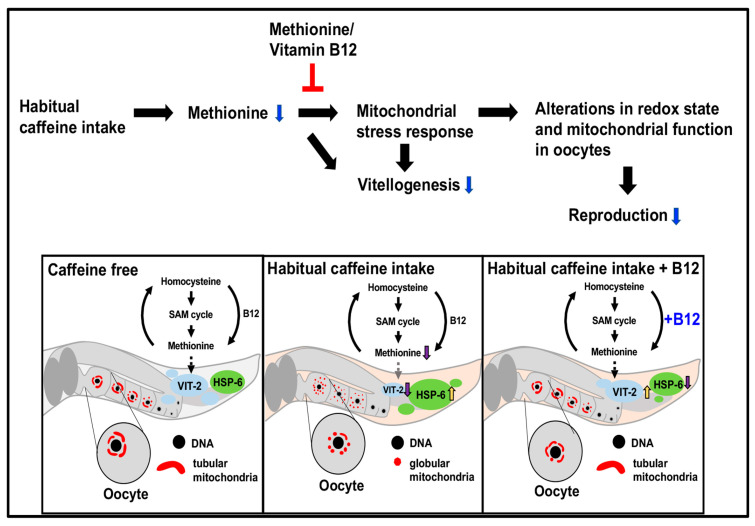
Vitamin B12 is an essential cofactor involved in the function of two enzymes: cytosolic methionine synthase and mitochondrial methylmalonic-CoA mutase. In our previous studies, caffeine (1,3,7-trimethylxanthine), the most popular bioactivator, was shown to reduce yolk protein (vitellogenin) and fertility in a Caenorhabditis elegans model. Based on the previous finding that methionine supplementation increases vitellogenesis in C. elegans, we investigated the role of vitamin B12 in methionine-mediated vitellogenesis during oogenesis in caffeine-ingested animals (CIA). Vitamin B12 supplementation improved vitellogenesis and reduced oxidative stress by decreasing mitochondrial function in CIA. Furthermore, the decreased number of developing oocytes and high levels of reactive oxygen species in oocytes from CIA were recovered with vitamin B12 supplementation through a reduction in mitochondrial stress, which increased vitellogenesis. Taken together, vitamin B12 supplementation can reverse the negative effects of caffeine intake by enhancing methionine-mediated vitellogenesis and oocyte development by reducing mitochondrial stress.

Keywords: Caenorhabditis elegans; caffeine; mitochondria; oogenesis; vitamin B12; yolk protein.


Conflict of interest statement

The authors declare no conflicts of interest.

Figures

Figure 1
Figure 1
Effects of a bacterial vitamin B12 diet on vitellogenin (yolk protein) and larval development in caffeine-ingested animals (CIA). (A) Vitamin B12-dependent pathways in the mitochondrion and cytosol. (B) An experimental scheme for the effect of three different bacterial diets on CIA. (C) Representative images and graphs show the intensity of VIT-2::GFP in OP50, HB101, and DA1877 bacteria under caffeine or caffeine-free conditions. Bar, 50 μm. (D) Representative images and graphs show the intensity of VIT-2::GFP with or without methionine (Met) treatment in CIA. Bar, 25 μm. (E,F) Developmental growth (E) and body length (F) in animals fed with or without caffeine under OP50, HB101, and DA1877 bacteria. Data represent mean ± standard deviation. n.s., p > 0.5. *, p < 0.05. ***, p < 0.001. Number of analyzed animals, n ≥ 25 in respective conditions.
Figure 1
Figure 1
Effects of a bacterial vitamin B12 diet on vitellogenin (yolk protein) and larval development in caffeine-ingested animals (CIA). (A) Vitamin B12-dependent pathways in the mitochondrion and cytosol. (B) An experimental scheme for the effect of three different bacterial diets on CIA. (C) Representative images and graphs show the intensity of VIT-2::GFP in OP50, HB101, and DA1877 bacteria under caffeine or caffeine-free conditions. Bar, 50 μm. (D) Representative images and graphs show the intensity of VIT-2::GFP with or without methionine (Met) treatment in CIA. Bar, 25 μm. (E,F) Developmental growth (E) and body length (F) in animals fed with or without caffeine under OP50, HB101, and DA1877 bacteria. Data represent mean ± standard deviation. n.s., p > 0.5. *, p < 0.05. ***, p < 0.001. Number of analyzed animals, n ≥ 25 in respective conditions.
Figure 2
Figure 2
Effects of vitamin B12 supplementation on vitellogenin and mitochondrial stress response in CIA. (A) Representative images show that VIT-2::GFP transgenic animals were synchronized at the L4 stage and fed with killed OP50 and DA1877 bacteria with or without caffeine for 24 h at 20 °C. Bar, 50 μm. (B) An experimental scheme for effects of vitamin B12 on CIA. (C) Comparison of the intensity of VIT-2::GFP in OP50- or DA1877-fed CIA with or without B12 supplementation. Bar, 50 μm. (D) Comparison of the intensity of HSP-6::GFP in CIA fed with OP50 or DA1877 with or without vitamin B12, or with high peptone. Heat stress (HS) was used as a positive control. Bar, 25 μm. Data represent mean ± standard deviation. n.s., p > 0.5. ***, p < 0.001. Number of analyzed animals, n ≥ 25 in respective conditions.
Figure 3
Figure 3
Effects of vitamin B12 on oogenesis in CIA. (A) Quantification of the number of oocytes produced by CIA fed with OP50 or DA1877 with or without vitamin B12. (BD) Representative gonad images of DAPI staining (B) show the number of germ nuclei in diplotene (C) and diakinesis (D) in CIA fed the corresponding bacterial diet with vitamin B12 supplementation. The red dotted line indicates diplotene. Bar, 20 μm. The yellow-colored number indicates the developing oocytes that aligned from the proximal region; d, distal side of the gonad arm; p, proximal side of the gonad arm. (E) Comparison of mitochondrial morphology in the oocytes of caffeine-ingested EGD623 (egxSi152 [mex-5p: tomm-20::gfp::pie-1]) transgenic animals fed OP50 or DA1877 and supplemented with or without vitamin B12. The type of mitochondrial morphology was classified as tubular or globular. Bar, 5 μm. (F,G) Comparison of mitochondrial reactive oxygen species through CellROX Green staining (F) and mitochondrial membrane potential through TMRM staining (G) in the oocytes of CIA fed with OP50 or DA1877 supplemented with or without vitamin B12. Bar, 5 μm. The violin plot shows the relative level of intensity of CellRox Green (F). The line graph shows the relative intensity of TMRM in oocytes. Data represent mean ± standard deviation. n.s., p > 0.05. ***, p < 0.001. Number of analyzed animals, n ≥ 20 in respective conditions.
Figure 4
Figure 4
The antioxidant effect of vitamin B12 on oocyte mitochondria and vitellogenin in CIA. (A) Comparison of mitochondrial morphology in the oocytes of transgenic animals (EGD623, egxSi152 [mex-5p:: tomm-20::gfp::pie-1]) fed with or without caffeine after NAC treatment. Bar, 5 μm. The graph shows the distribution of mitochondrial morphology in the −1 oocyte. (B) Representative images and graphs show the relative level of mitochondrial reactive oxygen species using CellROX Green dye in the oocytes of CIA with NAC treatment. Bar, 5 μm. (C) Comparison of the relative intensity of VIT-2::GFP in CIA supplemented with NAC or NAC + vitamin B12. Bar, 50 μm. (D) The graph shows the number of diakinesis oocytes in CIA supplemented with NAC or NAC + vitamin B12. Data represent mean ± standard deviation. *, p < 0.05. **, p < 0.01. ***, p < 0.001. Number of analyzed animals, n ≥ 20 in respective conditions.
Figure 5
Figure 5
Correlated effects of vitellogenin and mitochondrial stress. (A) vit-2 RNAi effectively suppressed in VIT-2::GFP transgenic animals. Representative images of VIT-2::GFP transgenic animals following vit-2 RNAi treatment. Bar, 25 μm. ***, p < 0.001. Number of analyzed animals, n ≥ 20 in respective conditions. (B) The representative images and bar graph show the comparison of mitochondrial morphology in the oocytes of EGD623 (egxSi152 [mex-5p:: tomm-20::gfp::pie-1]) transgenic animals treated with mock or vit-2 RNAi. Bar, 5 μm. (C) Representative images and violin plots show the comparison of the relative intensity of HSP-6::GFP treated with mock, vit-2, and cco-1 RNAi. cco-1 RNAi was used as a positive control to induce the mitochondrial stress response. Bar, 25 μm. (D) Representative images and a violin plot show the comparison of the relative intensity of VIT-2::GFP treated with mock and cco-1 RNAi. Bar, 25 μm. Data represent mean ± standard deviation. n.s., p > 0.5. **, p < 0.01. Number of analyzed animals, n ≥ 20 in respective conditions.
Figure 6
Figure 6
The illustration proposes a working model for this study.

Similar articles

Cited by

References

    1. Panagiotou M., Meijer M., Meijer J.H., Deboer T. Effects of Chronic Caffeine Consumption on Sleep and the Sleep Electroencephalogram in Mice. J. Psychopharmacol. 2019;33:122–131. doi: 10.1177/0269881118806300. - DOI - PMC - PubMed
    1. Haraguchi A., Yamazaki T., Ryan C., Ito K., Sato S., Tamura K., Sekiguchi M., Cao S., Shibata S. Caffeine Suppresses High-Fat Diet-Induced Body Weight Gain in Mice Depending on Feeding Timing. J. Funct. Foods. 2022;99:105307. doi: 10.1016/j.jff.2022.105307. - DOI
    1. Li H., Roxo M., Cheng X., Zhang S., Cheng H., Wink M. Pro-Oxidant and Lifespan Extension Effects of Caffeine and Related Methylxanthines in Caenorhabditis elegans. Food Chem. X. 2019;1:100005. doi: 10.1016/j.fochx.2019.100005. - DOI - PMC - PubMed
    1. Leung M.C.K., Williams P.L., Benedetto A., Au C., Helmcke K.J., Aschner M., Meyer J.N. Caenorhabditis elegans: An Emerging Model in Biomedical and Environmental Toxicology. Toxicol. Sci. 2008;106:5–28. doi: 10.1093/toxsci/kfn121. - DOI - PMC - PubMed
    1. Min H., Kawasaki I., Gong J., Shim Y.H. Caffeine Induces High Expression of Cyp-35A Family Genes and Inhibits the Early Larval Development in Caenorhabditis elegans. Mol. Cells. 2015;38:236–242. doi: 10.14348/molcells.2015.2282. - DOI - PMC - PubMed

LinkOut - more resources