. 2024 Jan 8;13(1):78.
doi: 10.3390/antiox13010078.

Amphiregulin Exerts Proangiogenic Effects in Developing Murine Lungs

Affiliations

Amphiregulin Exerts Proangiogenic Effects in Developing Murine Lungs

Shyam Thapa et al. Antioxidants (Basel). .

Abstract

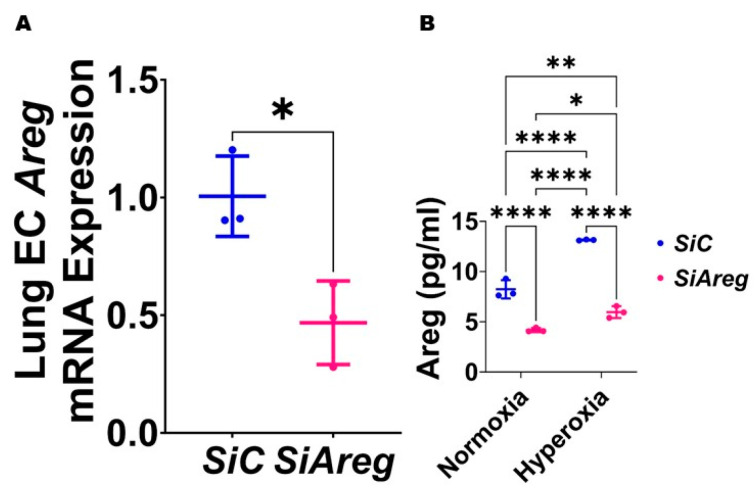
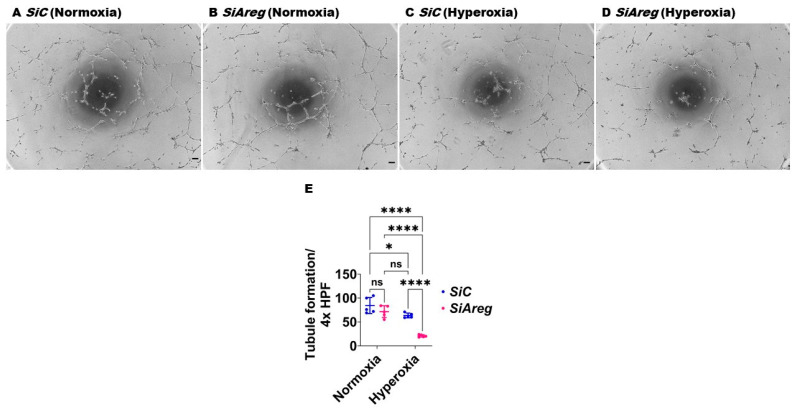
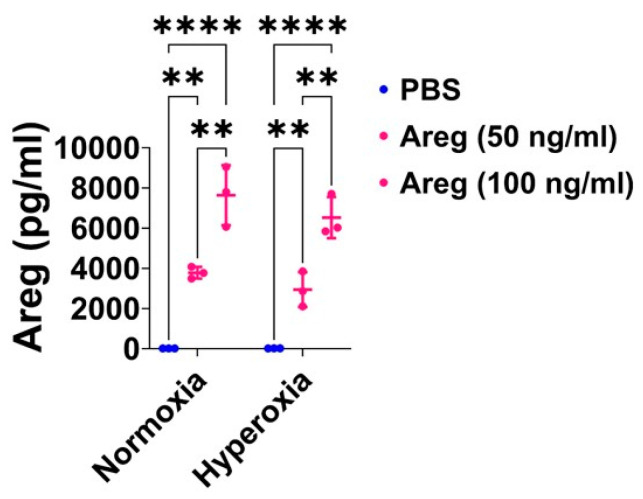
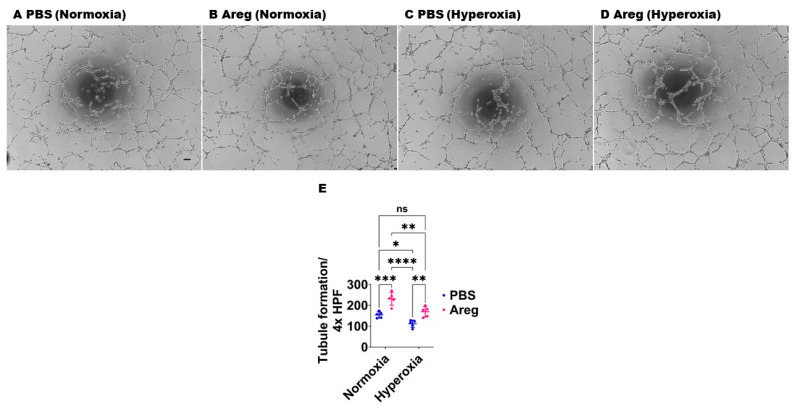
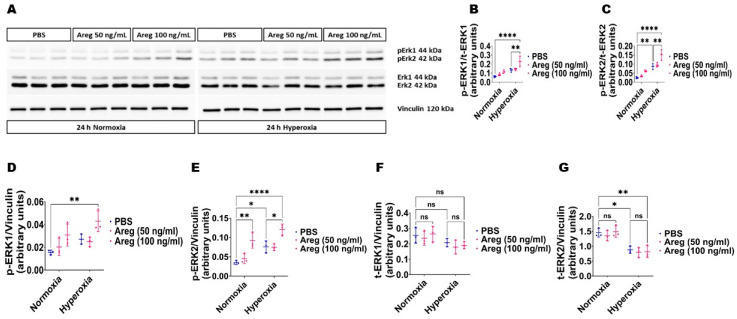
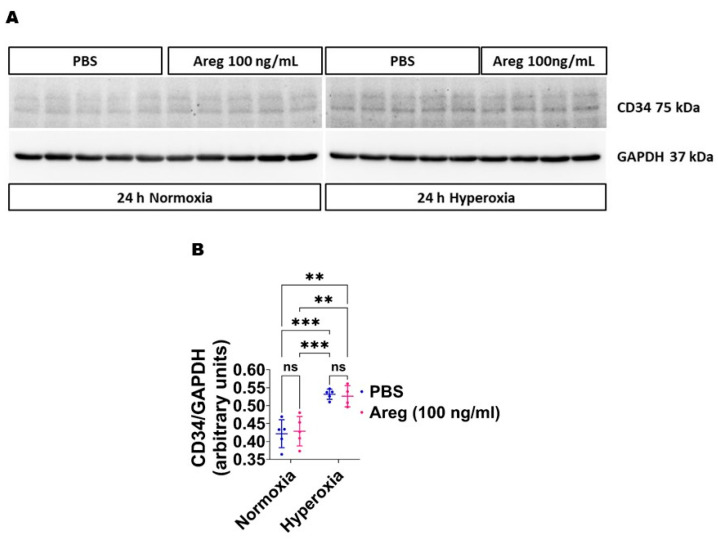
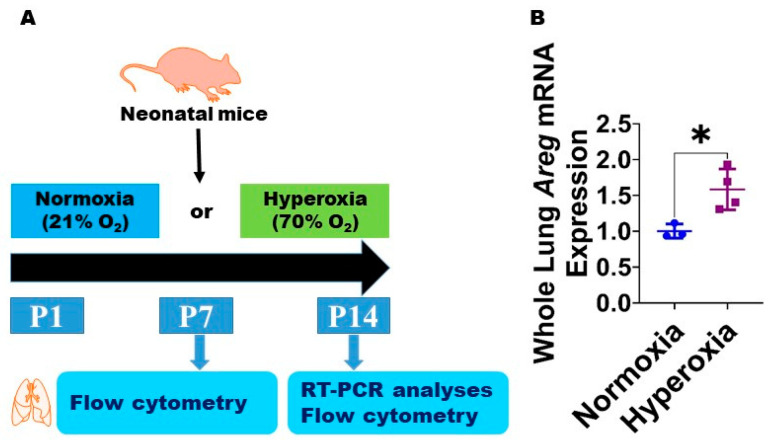
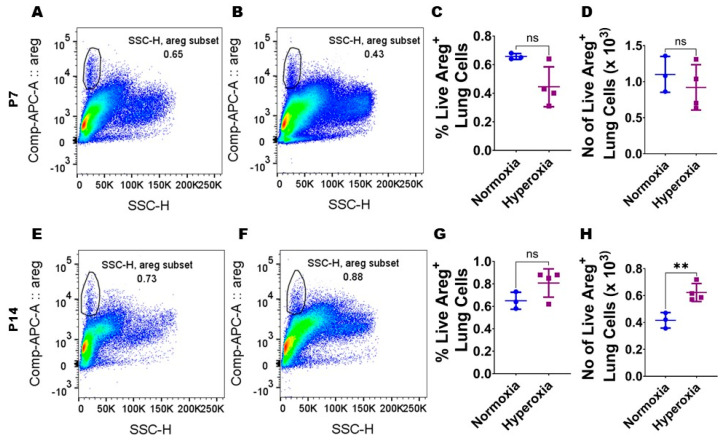
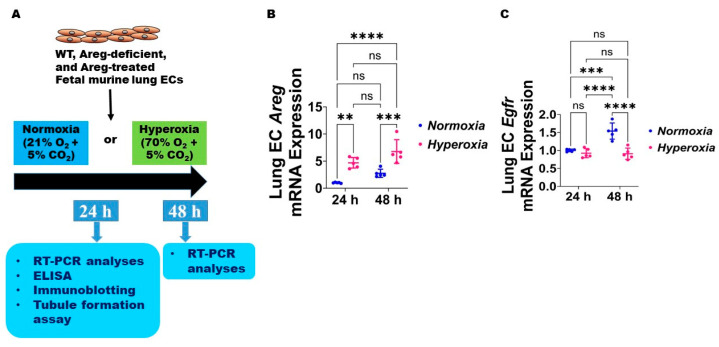
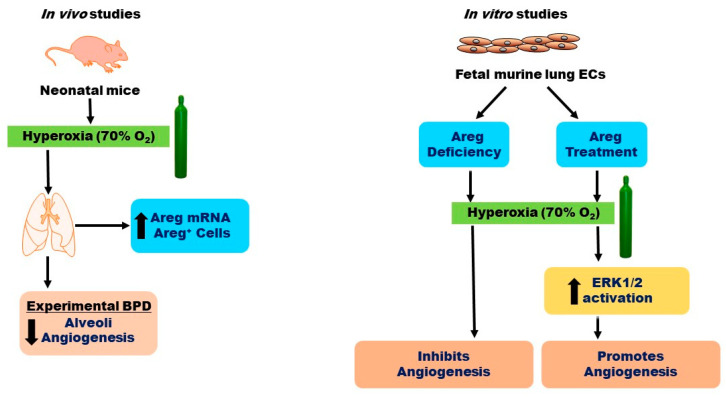
Interrupted lung angiogenesis is a hallmark of bronchopulmonary dysplasia (BPD); however, druggable targets that can rescue this phenotype remain elusive. Thus, our investigation focused on amphiregulin (Areg), a growth factor that mediates cellular proliferation, differentiation, migration, survival, and repair. While Areg promotes lung branching morphogenesis, its effect on endothelial cell (EC) homeostasis in developing lungs is understudied. Therefore, we hypothesized that Areg promotes the proangiogenic ability of the ECs in developing murine lungs exposed to hyperoxia. Lung tissues were harvested from neonatal mice exposed to normoxia or hyperoxia to determine Areg expression. Next, we performed genetic loss-of-function and pharmacological gain-of-function studies in normoxia- and hyperoxia-exposed fetal murine lung ECs. Hyperoxia increased Areg mRNA levels and Areg+ cells in whole lungs. While Areg expression was increased in lung ECs exposed to hyperoxia, the expression of its signaling receptor, epidermal growth factor receptor, was decreased, indicating that hyperoxia reduces Areg signaling in lung ECs. Areg deficiency potentiated hyperoxia-mediated anti-angiogenic effects. In contrast, Areg treatment increased extracellular signal-regulated kinase activation and exerted proangiogenic effects. In conclusion, Areg promotes EC tubule formation in developing murine lungs exposed to hyperoxia.

Keywords: amphiregulin; angiogenesis; bronchopulmonary dysplasia; fetal murine lung endothelial cells; hyperoxia.


Conflict of interest statement

The authors declare no conflict of interest.

Figures

Figure 4
Figure 4
Transfection with Areg siRNA efficiently decreases Areg expression in fetal mouse lung endothelial-like cells. The RNA was extracted from fetal mouse lung endothelial-like cells transfected with control (n = 3) or Areg (n = 3) siRNA in normoxic conditions and subjected to RT-PCR analysis to quantify Areg mRNA expression (A). Values are presented as mean ± SD. T-test was used for the statistical analyses. Significant differences between exposures are indicated by *, p < 0.05. Subsequently, Areg protein expression was quantified by ELISA (B) in the cell culture supernatants of fetal mouse lung endothelial-like cells transfected with control or Areg siRNA and exposed to 21% O2 (normoxia; n = 3/group) or 70% O2 (hyperoxia; n = 3/group). Values are presented as mean ± SD. Analysis of variance was used for the statistical analyses. Significant differences between exposures are indicated by *, p < 0.05, **, p < 0.01, and ****, p < 0.0001.
Figure 5
Figure 5
Effects of Areg deficiency on the tubule formation ability of fetal mouse lung endothelial-like cells. Matrigel assay was performed to quantify the tubule formation ability using fetal mouse lung endothelial-like cells transfected with control or Areg siRNA and exposed to normoxia (21% O2 and 5% CO2, n = 5/group) or hyperoxia (70% O2 and 5% CO2, n = 5/group). (AD) Representative photographs showing tubule formation of cells transfected with control (A,C) or Areg (B,D) siRNA and exposed to normoxia (A,B) or hyperoxia (C,D). (E) Quantification of tubule formation. Scale bar = 100 µm. Data are expressed as mean ± SD. Analysis of variance was used for the statistical analyses. ns = not significant. Significant differences between exposures are indicated by *, p < 0.05, and ****, p < 0.0001.
Figure 6
Figure 6
Areg treatment efficiently increases Areg protein expression in the cell culture supernatant of fetal mouse lung endothelial-like cells. Areg protein expression was quantified by ELISA in the cell culture supernatant of fetal mouse lung endothelial-like cells treated with the vehicle, phosphate-buffered saline (PBS), or up to 100 ng/mL of recombinant mouse Areg and exposed to normoxia (21% O2 and 5% CO2, n = 3/group) or hyperoxia (70% O2 and 5% CO2, n = 3/group). Values are presented as mean ± SD. Analysis of variance was used for the statistical analyses. Significant differences between exposures are indicated by **, p < 0.01 and ****, p < 0.0001.
Figure 7
Figure 7
Effects of Areg treatment on the tubule formation ability of fetal mouse lung endothelial-like cells. Matrigel assay was performed to quantify the tubule formation ability using fetal mouse lung endothelial-like cells treated with phosphate-buffered saline (PBS) or 100 ng/mL of recombinant mouse Areg and exposed to normoxia (21% O2 and 5% CO2, n = 5/group) or hyperoxia (70% O2 and 5% CO2, n = 5/group). (AD) Representative photographs showing tubule formation of cells treated with PBS (A,C) or Areg (B,D) and exposed to normoxia (A,B) or hyperoxia (C,D). (E) Quantification of tubule formation. Scale bar = 100 µm. Data are expressed as mean ± SD. Analysis of variance was used for the statistical analyses. ns = not significant. Significant differences between exposures are indicated by *, p < 0.05, **, p < 0.01, ***, p < 0.001, and ****, p < 0.0001.
Figure 8
Figure 8
Effects of Areg treatment on ERK1/2 activation in fetal mouse lung endothelial-like cells. Whole-cell protein lysates extracted from fetal mouse lung endothelial-like cells treated with phosphate-buffered saline (PBS) or up to 100 ng/mL of recombinant mouse Areg and exposed to normoxia (21% O2 and 5% CO2, n = 3/group) or hyperoxia (70% O2 and 5% CO2, n = 3/group) were subjected to immunoblotting to quantify ERK1/2 activation. (A) Representative immunoblot showing the protein expression of total (t) and phosphorylated (p) ERK1/2 and vinculin. (B,C) Quantitative densitometric analyses after normalizing of p-ERK1 (B) and p-ERK2 (C) band intensities to those of t-ERK1 and t-ERK2, respectively. (DG) Quantitative densitometric analyses after normalizing of p-ERK1 (D), p-ERK2 (E), t-ERK1 (F), and t-ERK2 (G) band intensities to those of vinculin. Data are expressed as mean ± SD. Analysis of variance was used for the statistical analyses. ns = not significant. Significant differences between exposures are indicated by *, p < 0.05, **, p < 0.01, and ****, p < 0.0001.
Figure 9
Figure 9
Effects of Areg treatment on CD34 protein expression in fetal mouse lung endothelial-like cells. Whole-cell protein lysates extracted from fetal mouse lung endothelial-like cells treated with phosphate-buffered saline (PBS) or 100 ng/mL of recombinant mouse Areg and exposed to normoxia (21% O2 and 5% CO2, n = 5/group) or hyperoxia (70% O2 and 5% CO2, n = 4–5/group) were subjected to immunoblotting to quantify CD34 protein expression. (A) Representative immunoblot showing the protein expression of CD34 and GAPDH (A). Quantitative densitometric analyses after normalizing of CD34 band intensities to those of GAPDH (B). Data are expressed as mean ± SD. Analysis of variance was used for the statistical analyses. ns = not significant. Significant differences between exposures are indicated by **, p < 0.01, and ***, p < 0.001.
Figure 1
Figure 1
Hyperoxia (HO) exposure increases Areg mRNA in neonatal murine lungs. (A) Experimental design for Figure 1 and Figure 2. O2—oxygen, P—postnatal day, and RT-PCR—real-time polymerase chain reaction. Whole-lung mRNA was extracted from neonatal murine lungs after 14 d of 21% O2 (normoxia; n = 3) or 70% O2 (hyperoxia; n = 4) exposure and subjected to RT-PCR analysis to quantify Areg RNA expression (B). Data are expressed as mean ± SD. T-test was used for the statistical analyses. Significant differences between exposures are indicated by *, p < 0.05.
Figure 2
Figure 2
Hyperoxia (HO) exposure increases Areg+ cells in neonatal murine lungs. Single-cell suspensions from neonatal murine lungs exposed to 7 d or 14 d to 21% O2 (normoxia; n = 3/time-point) or 70% O2 (hyperoxia; n = 4/time-point) were extracted and subjected to flow cytometry analyses to quantify Areg+ cells. (A,B) Representative flow cytometry blots showing Areg+ lung cells from normoxia-exposed cells stained with live/dead stain and Areg antibody (A) and hyperoxia-exposed cells stained with live/dead stain and Areg antibody (B) after 7 d of exposure. (C,D) Quantification of Areg+ lung cell percentage (C) and number (D) after 7 d of exposure. (E,F) Representative flow cytometry plots showing Areg+ lung cells from normoxia-exposed cells stained with live/dead stain and Areg antibody (E) and hyperoxia-exposed cells stained with live/dead stain and Areg antibody (F) after 14 d of exposure. (G,H) Quantification of Areg+ lung cell percentage (G) and number (H) after 14 d of exposure. Data are expressed as mean ± SD. T-test was used for the statistical analyses. ns = not significant. Significant differences between exposures are indicated by **, p < 0.01.
Figure 3
Figure 3
Hyperoxia (HO) exposure disrupts Areg signaling in fetal mouse lung endothelial-like cells. (A) Experimental design for Figure 3, Figure 4, Figure 5, Figure 6, Figure 7, Figure 8 and Figure 9. WT—wild type, Areg—amphiregulin, ECs—endothelial cells, O2—oxygen, CO2—carbon dioxide, RT-PCR—real-time polymerase chain reaction, and ELISA—enzyme-linked immunosorbent assay. The RNA was extracted from the fetal mouse lung endothelial-like cells exposed for 24 h or 48 h to 21% O2 (normoxia; n = 5/time-point) or 70% O2 (hyperoxia; n = 5/time-point) and subjected to RT-PCR analyses to quantify the mRNA expression of Areg (B) and Egfr (C). Data are expressed as mean ± SD. ns = not significant. Analysis of variance was used for the statistical analyses. Significant differences between exposures are indicated by **, p < 0.01, ***, p < 0.001, and ****, p < 0.0001.
Figure 10
Figure 10
Overview of the results. O2—oxygen, BPD—bronchopulmonary dysplasia, ECs—endothelial cells, Areg—amphiregulin, and ERK—extracellular signal-regulated kinase.

Similar articles

Cited by

  • Emerging Roles of Eosinophils in Bone.
    Andreev D, Porschitz P. Andreev D, et al. Curr Osteoporos Rep. 2025 Apr 4;23(1):17. doi: 10.1007/s11914-025-00913-6. Curr Osteoporos Rep. 2025. PMID: 40183859 Free PMC article. Review.

References

    1. Thébaud B., Goss K.N., Laughon M., Whitsett J.A., Abman S.H., Steinhorn R.H., Aschner J.L., Davis P.G., McGrath-Morrow S.A., Soll R.F., et al. Bronchopulmonary dysplasia. Nat. Rev. Dis. Primers. 2019;5:78. doi: 10.1038/s41572-019-0127-7. - DOI - PMC - PubMed
    1. Simpson S.J., Hall G.L., Wilson A.C. Lung function following very preterm birth in the era of ‘new’ bronchopulmonary dysplasia. Respirology. 2015;20:535–540. doi: 10.1111/resp.12503. - DOI - PubMed
    1. Islam J.Y., Keller R.L., Aschner J.L., Hartert T.V., Moore P.E. Understanding the Short- and Long-Term Respiratory Outcomes of Prematurity and Bronchopulmonary Dysplasia. Am. J. Respir. Crit. Care Med. 2015;192:134–156. doi: 10.1164/rccm.201412-2142PP. - DOI - PMC - PubMed
    1. Twilhaar E.S., Wade R.M., de Kieviet J.F., van Goudoever J.B., van Elburg R.M., Oosterlaan J. Cognitive Outcomes of Children Born Extremely or Very Preterm Since the 1990s and Associated Risk Factors: A Meta-analysis and Meta-regression. JAMA Pediatr. 2018;172:361–367. doi: 10.1001/jamapediatrics.2017.5323. - DOI - PMC - PubMed
    1. Haggie S., Robinson P., Selvadurai H., Fitzgerald D.A. Bronchopulmonary dysplasia: A review of the pulmonary sequelae in the post-surfactant era. J. Paediatr. Child Health. 2020;56:680–689. doi: 10.1111/jpc.14878. - DOI - PubMed