Review
. 2024 Jan 3;13(1):1.
doi: 10.3390/biotech13010001.

Gene Therapy for Genetic Syndromes: Understanding the Current State to Guide Future Care

Affiliations
Review

Gene Therapy for Genetic Syndromes: Understanding the Current State to Guide Future Care

Marian L Henderson et al. BioTech (Basel). .

Abstract

Gene therapy holds promise as a life-changing option for individuals with genetic variants that give rise to disease. FDA-approved gene therapies for Spinal Muscular Atrophy (SMA), cerebral adrenoleukodystrophy, β-Thalassemia, hemophilia A/B, retinal dystrophy, and Duchenne Muscular Dystrophy have generated buzz around the ability to change the course of genetic syndromes. However, this excitement risks over-expansion into areas of genetic disease that may not fit the current state of gene therapy. While in situ (targeted to an area) and ex vivo (removal of cells, delivery, and administration of cells) approaches show promise, they have a limited target ability. Broader in vivo gene therapy trials have shown various continued challenges, including immune response, use of immune suppressants correlating to secondary infections, unknown outcomes of overexpression, and challenges in driving tissue-specific corrections. Viral delivery systems can be associated with adverse outcomes such as hepatotoxicity and lethality if uncontrolled. In some cases, these risks are far outweighed by the potentially lethal syndromes for which these systems are being developed. Therefore, it is critical to evaluate the field of genetic diseases to perform cost-benefit analyses for gene therapy. In this work, we present the current state while setting forth tools and resources to guide informed directions to avoid foreseeable issues in gene therapy that could prevent the field from continued success.

Keywords: clinical trials; gene therapy; genetic syndromes.


Conflict of interest statement

The authors declare no conflicts of interest.

Figures

Figure 1
Figure 1
Schematic of three gene therapy approaches: in vivo, ex vivo, and in situ. Generated with BioRender.
Figure 2
Figure 2
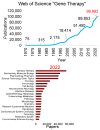
Publications on “gene therapy.” The first panel shows the number of publications found on Web of Science per year for the search “gene therapy,” with every five years labeled in black. The number of publications in 2022 is in red. The second panel shows the breakdown of the top 20 research areas of the 2022 papers. The analysis was performed on 18 April 2023.
Figure 3
Figure 3
NIH funding mentioning “Gene Therapy.” The first panel shows the funding (in millions of USD) per year by the National Institutes of Health (NIH) mentioning the term “gene therapy” in various annotation bins (mentioned in project: gray—title, yellow—abstract, cyan—terms, red—any of the three). The total annotated funding in 2022 is in red text. The second panel shows the breakdown of the top NIH institutes of the 2022 NIH funding for “Gene Therapy.” Abbreviations: NCI—National Cancer Institute, NIAID—National Institute of Allergy and Infectious Diseases, NHLBI—National Heart, Lung, and Blood Institute, NIA—National Institute on Aging, NINDS—National Institute of Neurological Disorders and Stroke, NIDDK—National Institute of Diabetes and Digestive and Kidney Diseases, NIGMS—National Institute of General Medical Sciences, NEI—National Eye Institute, NIDA—National Institute on Drug Abuse, NICHD—Eunice Kennedy Shriver National Institute of Child Health and Human Development. The analysis was performed on 1 May 2023 using NIH reporter.
Figure 4
Figure 4
Word usage for “gene therapy” and “rare disease” within all NIH-funded projects. The analysis was performed using WordClouds.com. The first panel shows words enriched within the 787 funded project titles. The second panel shows words enriched from their public health relevance statements. The analysis was performed on 1 May 2023 using NIH reporter.
Figure 5
Figure 5
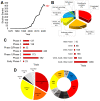
Analysis of ClinicalTrials.gov for “gene therapy.” All analyses were performed on 18 April 2023 using the ClinicalTrial.gov site. (A) Number of trials started each year, with the 2022 number in red. (B) Breakdown of trial status. Groups below 2% are not shown. (C) Breakdown of completed trials for FDA phase and age group inclusion. (D) Breakdown of the delivery system used, with a call out of adeno-associated virus subtypes shown to the right.
Figure 6
Figure 6
OMIM genes connecting human genotypes to phenotypes. (A) Number of OMIM genes per chromosome. (B) The number of OMIM genes with various human UniProt annotations. (C) Tissue- or (D) single-cell-specific expression annotation from the Human Protein Atlas for each of the OMIM genes. (E) The number of OMIM genes with various International Mouse Phenotyping Consortium (IMPC) annotations following knockout and phenotyping. (F) Each OMIM gene number of IMPC phenotypes altered in knockout (x-axis) relative to the % of datasets from the Human Protein Atlas where the gene is expressed >1 transcript per million (TPM). (G) The amino acid length of each OMIM gene (x-axis) relative to the number of ClinVar annotated pathogenic or likely pathogenic variants. (H) The percent of each variant class relative to variant alterations for the ClinVar database.
Figure 7
Figure 7
Heatmap of expression for cell-type-specific genes from the Human Protein Atlas. Red indicates the highest expression in the row. Dendrograms show one minus Spearman rank correlation with cell type on top and genes shown to the left.
Figure 8
Figure 8
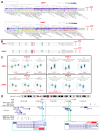
Isoforms and genetics of SMN1 and SMN2. (A) Top three protein-coding isoforms for SMN1 and SMN2 genes. (B) Exon map of isoforms within panel (A). (C) GTEx-measured eQTLs and sQTLs for the SMN1 and SMN2 genes. The significance and the population with the highest frequency of the variants are labeled in red below the violin plots. (D) Chromosome 5 map of the top eQTL and sQTL signals for SMN1 and SMN2.
Figure 9
Figure 9
Representative analysis of a variant colocalized for expression and phenotypes. The first panel shows variant allele frequency data from gnomAD population genomics sequencing. The GTEx eQTL plots show five different tissues with significant eQTLs for the variant within the NF1 gene. The bottom plot shows the Open Target Genetics [76] data curation for significant traits associated with this variant.
Figure 10
Figure 10
Summary of the ethical considerations of gene therapy. This figure was generated with BioRender.

References

    1. Wirth T., Parker N., Ylä-Herttuala S. History of Gene Therapy. Gene. 2013;525:162–169. doi: 10.1016/j.gene.2013.03.137. - DOI - PubMed
    1. Dunbar C.E., High K.A., Joung J.K., Kohn D.B., Ozawa K., Sadelain M. Gene Therapy Comes of Age. Science. 2018;359:eaan4672. doi: 10.1126/science.aan4672. - DOI - PubMed
    1. Hermonat P.L., Quirk J.G., Bishop B.M., Han L. The Packaging Capacity of Adeno-Associated Virus (AAV) and the Potential for Wild-Type-Plus AAV Gene Therapy Vectors. FEBS Lett. 1997;407:78–84. doi: 10.1016/S0014-5793(97)00311-6. - DOI - PubMed
    1. Ibraheem D., Elaissari A., Fessi H. Gene Therapy and DNA Delivery Systems. Int. J. Pharm. 2014;459:70–83. doi: 10.1016/j.ijpharm.2013.11.041. - DOI - PubMed
    1. El-Aneed A. An Overview of Current Delivery Systems in Cancer Gene Therapy. J. Control. Release. 2004;94:1–14. doi: 10.1016/j.jconrel.2003.09.013. - DOI - PubMed

LinkOut - more resources