. 2023 Dec 22;11(1):11.
doi: 10.3390/bioengineering11010011.

Metabolomic Profiling of the Secretome from Human Neural Stem Cells Flown into Space

Affiliations

Metabolomic Profiling of the Secretome from Human Neural Stem Cells Flown into Space

Juan Carlos Biancotti et al. Bioengineering (Basel). .

Abstract

The change in gravitational force has a significant effect on biological tissues and the entire organism. As with any alteration in the environment, microgravity (µG) produces modifications in the system inducing adaptation to the new condition. In this study, we analyzed the effect of µG on neural stem cells (NSCs) following a space flight to the International Space Station (ISS). After 3 days in space, analysis of the metabolome in culture medium revealed increased glycolysis with augmented pyruvate and glycerate levels, and activated catabolism of branched-chain amino acids (BCAA) and glutamine. NSCs flown into space (SPC-NSCs) also showed increased synthesis of NADH and formation of polyamine spermidine when compared to ground controls (GC-NSCs). Overall, the space environment appears to increase energy demands in response to the µG setting.

Keywords: cell metabolism; metabolomics; microgravity; neural stem cells; secretome; spaceflight.


Conflict of interest statement

The authors declare no conflict of interest.

Figures

Figure 1
Figure 1
Synopsis of the automated experiments. (a) On board SpaceX-16. (b) Timeline displaying initial media change at T + 2 d after NSCs reached space. After 3 days (T + 5 d), the second culture medium was recovered into the second tank just prior to unberth, and stored at 4 °C. This conditioned medium contains the molecules secreted solely while cells were onboarding the ISS. During ascent, descent, and space flight, cells were maintained at 37 °C. Upon arrival to our laboratory, the culture media were recovered separately and placed in numbered tubes with the addition of a cocktail of proteases inhibitors, and saved frozen at −80 °C. (c) View of the cell chamber, where mesh carriers with cells and the travel culture medium travelled. (d,e) Tanks that contained the fresh medium to be released at T + 2 to start the experiment. Tank 2 (E arrow) contained the second fresh medium with which the cells came back to Earth. There was not a 1 G control onboard the space station, as tests were performed two years prior to determine the optimal conditions for the cells. The STaARS-1 EF facility was created by STaARS, inspired by this study to reduce the time astronauts would have to invest in these experiments. This facility was activated, monitored, and controlled from STaARS’ headquarters in Houston, TX. We used a total of four units that were flown aboard SpaceX-16 on 5 December 2018. Image adapted from Vergnes et al. [16].
Figure 2
Figure 2
Random forest analysis (RFA). The assessment of blank, ground control, and SPC-flown NSCs was highly effective. The biochemical importance plot highlighted biochemicals related to a number of super family pathways: amino acids associated with glutaminolysis (Ala, Asn, Asp, Gln), amino acid metabolites from BCAA catabolism (1-carboxyethylisoleucine, 1-carboxyethylvaline, 2,3-dihydroxyisovalerate, 3-methyl-2-oxovalerate, alpha-ketoglutaramate), metabolites from nitrogen metabolism (urea, creatine, N-acetyl-putrescine), lipids associated with metabolism of phospholipids (malonate, glycerol, choline, glycerophosphorylcholine), and nucleotide metabolism (hypoxanthine, 2′-deoxycytidine). Random forest classification using named metabolites in media of blank compared to 1 G and 0 G NSCs gave a predictive accuracy of 100%. Random chance would be expected to yield a predictive accuracy of 33%. We found two molecules with unclear identities: X25035, which is most likely a peptide, and X25865. RFA was performed as previously described [20].
Figure 3
Figure 3
Global biochemical changes. (a) The statistical comparison of metabolites secreted by NSCs during the 3 days aboard the ISS vs. those secreted by GC-NSCs revealed a total of 221 biochemical alterations, of which 79 increased and 142 decreased. This secretome was produced and collected over 3 days, starting on T + 2 and concluding on T + 5, using the automated hardware. Therefore, it contains only those molecules secreted during the 3 days onboard the ISS. Only statistically significant species were considered in the analysis. (b) Principal component analysis (PCA) demonstrates that each of the three sample groups (NSC-SPC [red], NSC-GC [blue], and control medium [yellow]) have a different biochemical profile of its secretome after 3 days, based on its gravitational status.
Figure 4
Figure 4
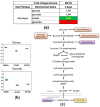
Glutaminolysis. (a) Table displaying the fold change ratio of glutamine and its metabolites after spending 3 days in space (0 G) vs. ground control (1 G). Values in red rectangles represent increased levels of the metabolites in space compared to ground control, whereas green rectangles highlight the opposite and white rectangles represent no change. (b) Scheme of the glutamine metabolic pathway.
Figure 5
Figure 5
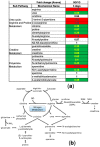
BCAA catabolism. (a) Table depicting the fold change ratio of the 3 BCAAs, leucine, isoleucine, and valine, and their metabolites after 3 days in space (SPC) or ground control (GC). Values in red rectangles represent increased levels of the metabolites in space compared to ground control, whereas green rectangles highlight the opposite and white rectangles represent no change. (b) Scheme of the BCAA metabolic pathways. (c) Example of the levels of 2 metabolites.
Figure 6
Figure 6
Glycolysis. (a) Table displaying fold change ratio of the glycolytic pathway metabolites at 3 days of 0 G vs. 1 G NCS secretome. Values in red rectangles represent increased levels of the metabolites in space compared to ground control, whereas green rectangles highlight the opposite and white rectangles represent no change. (b) Example of 2 metabolites levels. (c) Scheme of the glycolytic pathway.
Figure 7
Figure 7
NADH synthesis. (a) Table depicting fold change ratio of intermediates of the NADH synthesis pathway intermediates from NSC-SPC (0 G) vs. NSC-GC (1 G) after 3 days of incubation. Values in red rectangles represent increased levels of the metabolites in space compared to ground control, whereas green rectangles highlight the opposite and white rectangles represent no change. (b) Scheme of the “de novo” and “salvage” pathways.
Figure 8
Figure 8
Nitrogen Metabolism. (a) Table depicting the fold change ratio of nitrogen metabolism intermediates between 0 G vs. 1 G secretomes after 3 days of incubation. Nitrogen metabolites are divided into urea cycle, creatine metabolism, and polyamine metabolism pathways. Values in red rectangles represent increased levels of the metabolites in space compared to ground control, whereas green rectangles highlight the opposite and white rectangles represent no change. (b) Scheme of the integrated nitrogen metabolism.
Figure 9
Figure 9
The hierarchical cluster analysis (HCA) evaluates the variable clustering patterns of the metabolites from space--lown NSCs and ground control. We show the data in a table format, where the rows represent individual metabolites and the columns represent the secretome sample from which molecules were detected: STM medium (yellow), GC-NSCs (blue), and SPC-NSCs (red). The color of the cell reflects the concentration of each metabolite to its corresponding sample, relative to the mean concentration level across the entire set of tissue samples. Respectively, the colors red, blue, and white within the table indicate an increase, decrease, or no significant change of metabolites. The pathways that the metabolites belong to are indicated to the right of the HCA. The HCA compares the metabolite change between the 0 G, 1 G, and control groups. n  =  5 samples per group. HCA data analysis was generated using ArrayStudio.

Similar articles

Cited by

References

    1. Blaber E., Sato K., Almeida E.A. Stem Cell Health and Tissue Regeneration in Microgravity. Stem Cells Dev. 2014;23:73–78. doi: 10.1089/scd.2014.0408. - DOI - PMC - PubMed
    1. Blaber E.A., Finkelstein H., Dvorochkin N., Sato K.Y., Yousuf R., Burns B.P., Globus R.K., Almeida E.A., Oss-Ronen L., Redden R.A., et al. Microgravity Reduces the Differentiation and Regenerative Potential of Embryonic Stem Cells. Stem Cells Dev. 2015;24:2605–2621. doi: 10.1089/scd.2015.0218. - DOI - PMC - PubMed
    1. Lopez C., Blanke O. The thalamocortical vestibular system in animals and humans. Brain Res. Rev. 2011;67:119–146. doi: 10.1016/j.brainresrev.2010.12.002. - DOI - PubMed
    1. De la Torre G.G. Cognitive neuroscience in space. Life. 2014;4:281–294. doi: 10.3390/life4030281. - DOI - PMC - PubMed
    1. Van Ombergen A., Demertzi A., Tomilovskaya E., Jeurissen B., Sijbers J., Kozlovskaya I.B., Parizel P.M., Van de Heyning P.H., Sunaert S., Laureys S., et al. The effect of spaceflight and microgravity on the human brain. J. Neurol. 2017;264:18–22. doi: 10.1007/s00415-017-8427-x. - DOI - PMC - PubMed