

Blood Urea Nitrogen-to-Albumin Ratio May Predict Mortality in Patients with Traumatic Brain Injury from the MIMIC Database: A Retrospective Study
- PMID: 38247926
- PMCID: PMC10812946
- DOI: 10.3390/bioengineering11010049
Blood Urea Nitrogen-to-Albumin Ratio May Predict Mortality in Patients with Traumatic Brain Injury from the MIMIC Database: A Retrospective Study
Abstract
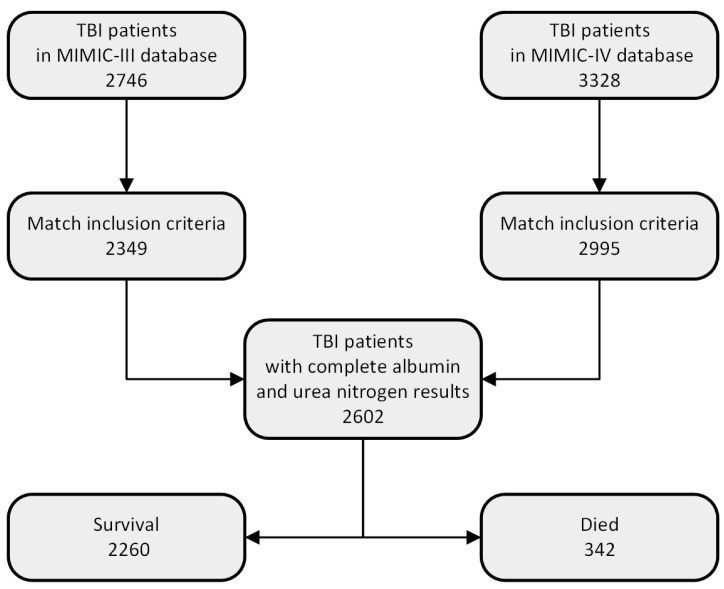
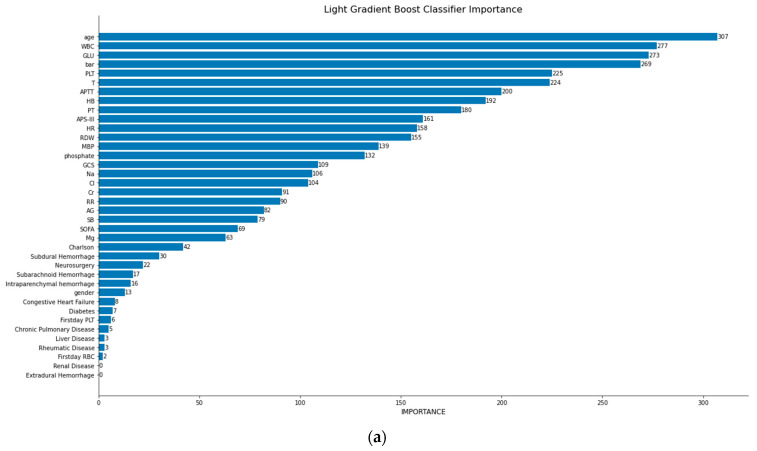
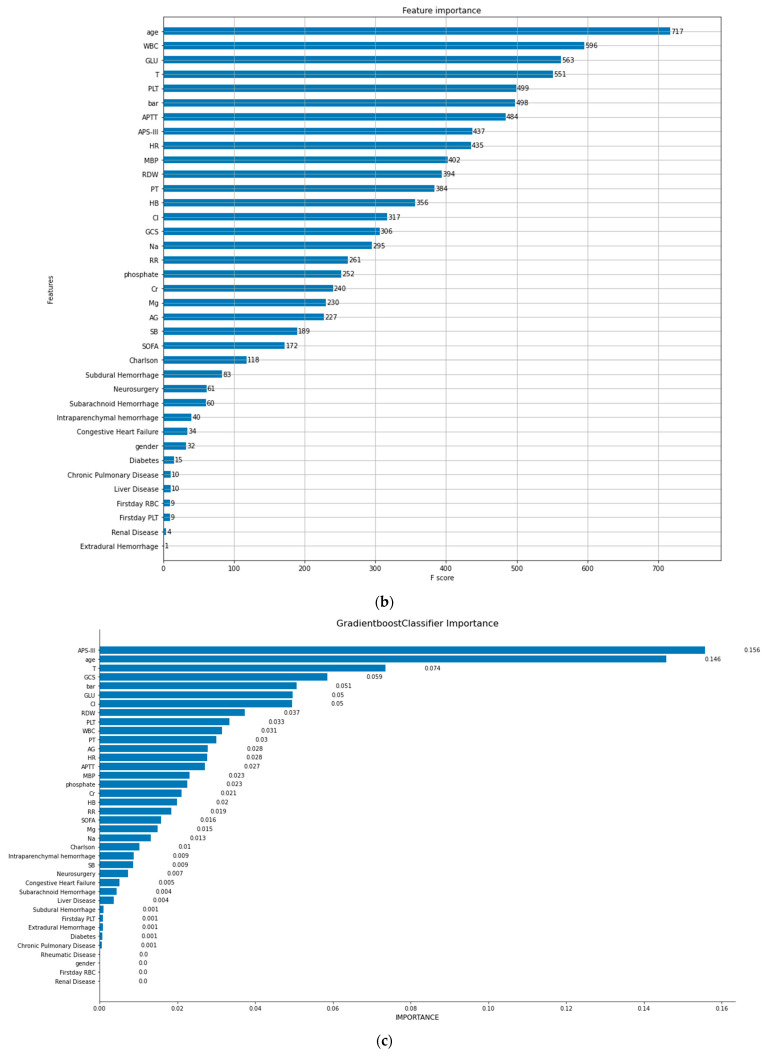
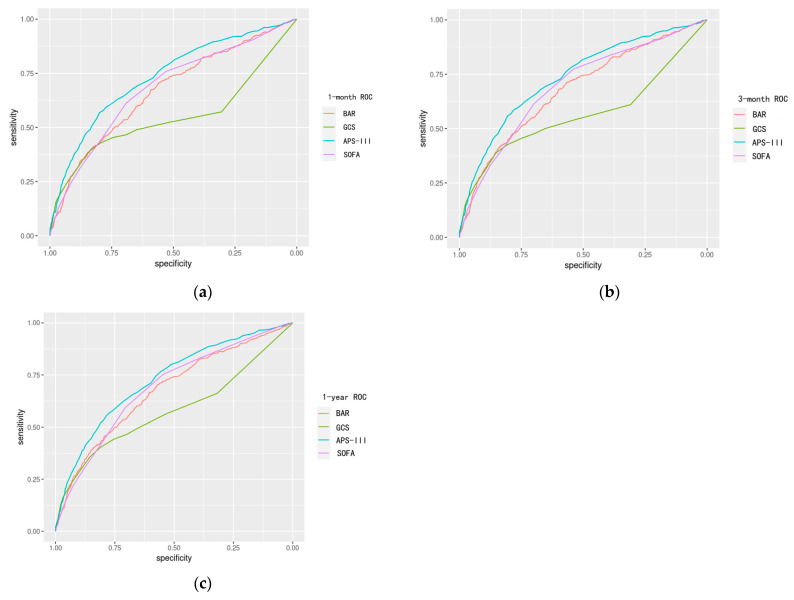
Traumatic brain injury (TBI), a major global health burden, disrupts the neurological system due to accidents and other incidents. While the Glasgow coma scale (GCS) gauges neurological function, it falls short as the sole predictor of overall mortality in TBI patients. This highlights the need for comprehensive outcome prediction, considering not just neurological but also systemic factors. Existing approaches relying on newly developed biomolecules face challenges in clinical implementation. Therefore, we investigated the potential of readily available clinical indicators, like the blood urea nitrogen-to-albumin ratio (BAR), for improved mortality prediction in TBI. In this study, we investigated the significance of the BAR in predicting all-cause mortality in TBI patients. In terms of research methodologies, we gave preference to machine learning methods due to their exceptional performance in clinical support in recent years. Initially, we obtained data on TBI patients from the Medical Information Mart for Intensive Care database. A total of 2602 patients were included, of whom 2260 survived and 342 died in hospital. Subsequently, we performed data cleaning and utilized machine learning techniques to develop prediction models. We employed a ten-fold cross-validation method to obtain models with enhanced accuracy and area under the curve (AUC) (Light Gradient Boost Classifier accuracy, 0.905 ± 0.016, and AUC, 0.888; Extreme Gradient Boost Classifier accuracy, 0.903 ± 0.016, and AUC, 0.895; Gradient Boost Classifier accuracy, 0.898 ± 0.021, and AUC, 0.872). Simultaneously, we derived the importance ranking of the variable BAR among the included variables (in Light Gradient Boost Classifier, the BAR ranked fourth; in Extreme Gradient Boost Classifier, the BAR ranked sixth; in Gradient Boost Classifier, the BAR ranked fifth). To further evaluate the clinical utility of BAR, we divided patients into three groups based on their BAR values: Group 1 (BAR < 4.9 mg/g), Group 2 (BAR ≥ 4.9 and ≤10.5 mg/g), and Group 3 (BAR ≥ 10.5 mg/g). This stratification revealed significant differences in mortality across all time points: in-hospital mortality (7.61% vs. 15.16% vs. 31.63%), as well as one-month (8.51% vs. 17.46% vs. 36.39%), three-month (9.55% vs. 20.14% vs. 41.84%), and one-year mortality (11.57% vs. 23.76% vs. 46.60%). Building on this observation, we employed the Cox proportional hazards regression model to assess the impact of BAR segmentation on survival. Compared to Group 1, Groups 2 and 3 had significantly higher hazard ratios (95% confidence interval (CI)) for one-month mortality: 1.77 (1.37-2.30) and 3.17 (2.17-4.62), respectively. To further underscore the clinical potential of BAR as a standalone measure, we compared its performance to established clinical scores, like sequential organ failure assessment (SOFA), GCS, and acute physiology score III(APS-III), using receiver operator characteristic curve (ROC) analysis. Notably, the AUC values (95%CI) of the BAR were 0.67 (0.64-0.70), 0.68 (0.65-0.70), and 0.68 (0.65-0.70) for one-month mortality, three-month mortality, and one-year mortality. The AUC value of the SOFA did not significantly differ from that of the BAR. In conclusion, the BAR is a highly influential factor in predicting mortality in TBI patients and should be given careful consideration in future TBI prediction research. The blood urea nitrogen-to-albumin ratio may predict mortality in TBI patients.
Keywords: blood urea nitrogen-to-albumin ratio; machine learning; the MIMIC database; traumatic brain injury.
Conflict of interest statement
The authors declare no conflicts of interest.
Figures

Similar articles
-
Prognostic value of blood urea nitrogen to albumin ratio in septic patients with acute kidney injury-a retrospective study based on MIMIC database.Front Med (Lausanne). 2025 May 7;12:1510919. doi: 10.3389/fmed.2025.1510919. eCollection 2025. Front Med (Lausanne). 2025. PMID: 40400629 Free PMC article.
-
[Construction of a predictive model for in-hospital mortality of sepsis patients in intensive care unit based on machine learning].Zhonghua Wei Zhong Bing Ji Jiu Yi Xue. 2023 Jul;35(7):696-701. doi: 10.3760/cma.j.cn121430-20221219-01104. Zhonghua Wei Zhong Bing Ji Jiu Yi Xue. 2023. PMID: 37545445 Chinese.
-
Exploring the value of blood urea nitrogen-to-albumin ratio in patients with acute pancreatitis admitted to the intensive care unit: a retrospective cohort study.Front Nutr. 2025 Apr 16;12:1435356. doi: 10.3389/fnut.2025.1435356. eCollection 2025. Front Nutr. 2025. PMID: 40308642 Free PMC article.
-
Blood Urea Nitrogen-to-Albumin Ratio in Predicting Long-Term Mortality in Patients Following Coronary Artery Bypass Grafting: An Analysis of the MIMIC-III Database.Front Surg. 2022 Feb 18;9:801708. doi: 10.3389/fsurg.2022.801708. eCollection 2022. Front Surg. 2022. PMID: 35252328 Free PMC article.
-
Comparing the Performance of Published Risk Scores in Brugada Syndrome: A Multi-center Cohort Study.Curr Probl Cardiol. 2022 Dec;47(12):101381. doi: 10.1016/j.cpcardiol.2022.101381. Epub 2022 Sep 2. Curr Probl Cardiol. 2022. PMID: 36058344 Review.
Cited by
-
BUN-to-ALB ratio as an effective predictor of 30 day mortality in ADHF patients in eastern China.ESC Heart Fail. 2025 Aug;12(4):2540-2551. doi: 10.1002/ehf2.15289. Epub 2025 Apr 1. ESC Heart Fail. 2025. PMID: 40170368 Free PMC article.
-
The Interrelation of Blood Urea Nitrogen-to-Albumin Ratio with Three-Month Clinical Outcomes in Acute Ischemic Stroke Cases: A Secondary Analytical Exploration Derived from a Prospective Cohort Study.Int J Gen Med. 2024 Nov 16;17:5333-5347. doi: 10.2147/IJGM.S483505. eCollection 2024. Int J Gen Med. 2024. PMID: 39574467 Free PMC article.
References
-
- Maas A.I.R., Menon D.K., Manley G.T., Abrams M., Åkerlund C., Andelic N., Aries M., Bashford T., Bell M.J., Bodien Y.G., et al. Traumatic brain injury: Progress and challenges in prevention, clinical care, and research. Lancet Neurol. 2022;21:1004–1060. doi: 10.1016/S1474-4422(22)00309-X. - DOI - PMC - PubMed
Grants and funding
LinkOut - more resources
Full Text Sources
Miscellaneous
