Review
. 2024 Jan 5;14(2):126.
doi: 10.3390/diagnostics14020126.

Imaging Features of Plantar Vein Thrombosis: An Easily Overlooked Condition in the Differential Diagnosis of Foot Pain

Affiliations
Review

Imaging Features of Plantar Vein Thrombosis: An Easily Overlooked Condition in the Differential Diagnosis of Foot Pain

Frederico Celestino Miranda et al. Diagnostics (Basel). .

Abstract

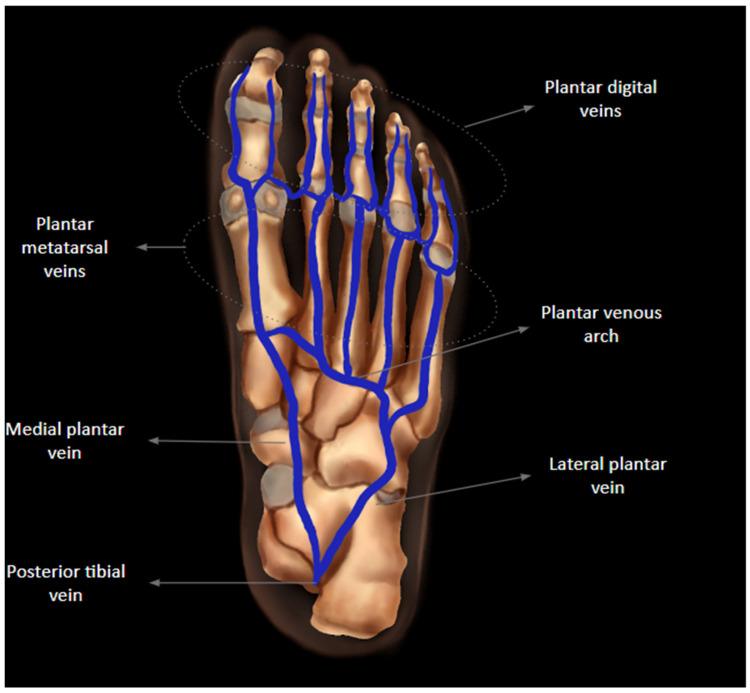
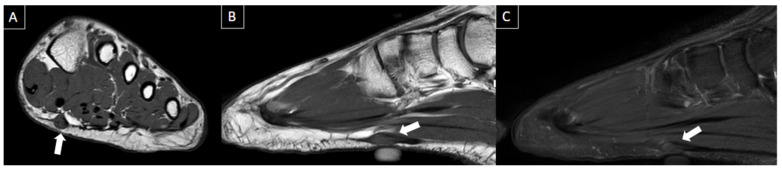
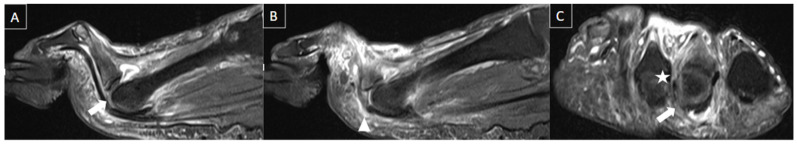
Plantar vein thrombosis is a venous disorder affecting deep plantar veins that can manifest with non-specific localized pain, plantar foot pain, swelling, and sensation of fullness. Plantar veins are not routinely assessed during sonographic scans for deep venous thrombosis, which makes plantar venous thrombosis a commonly missed diagnosis. This paper provides a comprehensive review of the venous anatomy of the foot and imaging findings of plantar venous thrombosis as well as discusses the current literature on the topic and its differential diagnoses.

Keywords: DVT; Doppler; MRI; deep venous thrombosis; foot pain; metatarsalgia; thrombophlebitis.


Conflict of interest statement

The authors declare no conflicts of interest.

Figures

Figure 1
Figure 1
Anatomic illustration of the venous anatomy of the foot, formed by plantar digital veins, plantar metatarsal veins, plantar venous arch, medial plantar vein, lateral plantar vein, and posterior tibial vein.
Figure 2
Figure 2
48-year-old female presenting with pain in the plantar aspect of the right ankle for 4 days. Ankle MR images in sagittal T2 fat-suppressed (A), post-gadolinium T1 fat-suppressed (B), and coronal T2 fat-suppressed (C) demonstrate thrombosis of the lateral plantar vein, characterized by venous enlargement with intraluminal thrombus (arrow in (A)), venous filling defect (arrow in (B)), and perivascular soft tissue edema and enhancement (stars from (A) to (C)).
Figure 3
Figure 3
The same patient from Figure 2 underwent an ultrasound with color Doppler showing enlargement of the lateral plantar vein due to an internal thrombus (arrows in (A)) and absence of flow on Doppler assessment (arrowheads in (B)) associated with loss of compressibility (stars in (C)).
Figure 4
Figure 4
50-year-old female patient with a history of pain in the foot for 12 days. MR images of the forefoot in the short axis (T2 weighted fat-suppressed short axis in (A,C) and T1 fat-suppressed post-gadolinium short axis in (B,D)) show acute thrombosis of the plantar venous arch and medial and lateral plantar veins, with perivascular edema (arrows in (A,C)) and perivascular enhancement and venous filling defects (arrowhead in (B,D)).
Figure 5
Figure 5
44-year-old female patient with history of rheumatoid arthritis and chronic pain in the left foot. T1-weighted (A) and T2-weighted fat-suppressed (B) and T1-weighted post-gadolinium (C) MR images of the forefoot in the short axis show intermetatarsal bursitis of the 1st interdigital space (arrows), abutting to the plantar fat pad.
Figure 6
Figure 6
56-year-old female patient with a 6-month history of pain. Short axis T1-weighted (A) and T2 fat-suppressed (B) MR images show Morton’s neuroma in the plantar aspect of the 2nd intermetatarsal space (arrows).
Figure 7
Figure 7
30-year-old female patient with pain in left foot for one month. Short axis T2-weighted fat-suppressed (A) and sagittal T2-weighted fat-suppressed (B) MR images and axial sesamoid radiographic views (C) present bone edema of the medial sesamoid on MRI (arrows) and irregular and sclerotic appearance of the lateral sesamoid with reduced dimensions (arrowheads). Findings are consistent with sesamoiditis.
Figure 8
Figure 8
55-year-old female patient with heel pain during walking for 4 months. Ankle MR images in sagittal T1-weighted (A), sagittal T2-weighted fat-suppressed (B), coronal T2-weighted fat-suppressed (C), and axial T2-weighted fat-suppressed (D) show significant plantar fasciitis of the proximal central bundle (arrows), characterized by thickening and partial tear of interstitial fibers. Bone edema at the calcaneal attachment and surrounding soft tissue inflammatory changes are also seen.
Figure 9
Figure 9
41-year-old male with swelling and pain in the left foot. Short axis T1-weighted (A), sagittal T1-weighted (B), and sagittal fat-suppressed T2-weighted (C) MR images present a fusiform nodule in the central band of the plantar fascia, at the midfoot level (arrows), consistent with plantar fibroma. The nodule correlates with the patient’s symptom location (cutaneous marker).
Figure 10
Figure 10
41-year-old male patient with pain in the left foot for four days after intense running exercise. MR images of the forefoot in sagittal T1 (A), sagittal T2-weighted fat-suppressed (B), and axial T2-weighted fat-suppressed (C) show tendinopathy of the retro and inframalleolar segment of peroneous brevis tendon with split tear extending to its insertion at the fifth metatarsal base (arrows).
Figure 11
Figure 11
54-year-old male with localized pain in the lateral aspect of the ankle. MR images in axial (A), coronal (B), and sagittal (C) T2-weighted fat-suppressed show multi lobulated and septated cyst in communication with sinus tarsi ligaments and posterior subtalar joint (arrows), extending into the lateral subcutaneous layer, consistent with synovial/ganglion cyst.
Figure 12
Figure 12
54-year-old female with history of bulimia and recent pain in the left foot after walking. MR images in the long axis (T2-weighted fat-suppressed in (A), and T1 fat-suppressed post gadolinium in (B)) show stress fracture of the 4th metatarsal neck associated with bone edema, periostitis, and edema of the surrounding soft tissues (arrows).
Figure 13
Figure 13
51-year-old male patient with acute forefoot pain during physical activities that happened months ago. MR images in sagittal T2-weighted fat-suppressed (A,B) and short axis post-gadolinium T1-weighted fat-suppressed (C) demonstrate complete tear of the distal insertion of the second metatarsophalangeal plantar plate (arrows), with proximal retraction (arrowhead) with associated lateral collateral ligament (star), with edema and enhancement of adjacent soft tissues.
Figure 14
Figure 14
56-year-old male patient with metatarsalgia for 6 months. MR images of the forefoot in the long axis (T2-weighted fat-suppressed (A) and T1-weighted (B)) and sagittal T1-weighted (C) present chronic deformity and depression of the second metatarsal head, with small subchondral cysts (arrows) suggestive of Freiberg’s infraction.
Figure 15
Figure 15
47-year-old male presenting with swelling and pain at the base of greater toe. MR images in short axis T1 fat-suppressed post-gadolinium (A), short axis T1-weighted (B), long axis T1-weighted (C), and T1 fat-suppressed post-gadolinium (D) show multiple foci of cortical erosions with edema and contrast enhancement, with associated synovial thickening and amorphous low signal intensity tissue suggestive of crystal deposits (arrows), notably at the metatarsophalangeal joint but also seen at the tarsometatarsal joints. Classic imaging features of gout.
Figure 16
Figure 16
53-year-old female presenting with paresthesia in the lateral plantar region. MR images of the forefoot in T2-weighted fat-suppressed short axis (A) and long axis (B) show mild edema of the abductor digiti minimi muscle (arrows), suggesting acute denervation due to compressive neuropathy (Baxter’s neuropathy).
Figure 17
Figure 17
40-year-old female patient with a history of twisting injury of the forefoot 10 days ago. MR images in T1 fat-suppressed post-gadolinium long axis show acute thrombosis of the second metatarsal vein with perivascular edema (arrow in (A)); (B) signs of recanalization of the thrombosis 1 month later, but still with mild surrounding edema (arrowheads).
Figure 18
Figure 18
Proposed algorithm on how to approach plantar vein thrombosis using imaging methods.

Similar articles

Cited by

References

    1. Kruger P.C., Eikelboom J.W., Douketis J.D., Hankey G.J. Deep vein thrombosis: Update on diagnosis and management. Med. J. Aust. 2019;210:516–524. doi: 10.5694/mja2.50201. - DOI - PubMed
    1. Edwards S.R., Wood O.D. Plantar vein thrombosis. Phlebol. J. Venous Dis. 2021;36:26–31. doi: 10.1177/0268355520946620. - DOI - PubMed
    1. Karam L., Tabet G., Nakad J., Gerard J.L. Spontaneous plantar vein thrombosis: State of the art. Phlebology. 2013;28:432–437. doi: 10.1177/0268355513477087. - DOI - PubMed
    1. Miranda F.C., Carneiro R.D., Longo C.H., Fernandes T.D., Rosemberg L.A., Funari M.B.D.G. Plantar thrombophlebitis: Magnetic resonance imaging findings. Rev. Bras. Ortop. 2012;47:765–769. doi: 10.1590/S0102-36162012000600016. - DOI - PMC - PubMed
    1. Rastel D. Four new cases of isolated foot vein thrombosis: Is the first metatarsal interspace perforator responsible? J. Médecine Vasc. 2021;46:114–122. doi: 10.1016/j.jdmv.2021.03.007. - DOI - PubMed

LinkOut - more resources