

Genetic Polymorphisms and Tumoral Mutational Profiles over Survival in Advanced Colorectal Cancer Patients: An Exploratory Study
- PMID: 38248103
- PMCID: PMC10814806
- DOI: 10.3390/curroncol31010018
Genetic Polymorphisms and Tumoral Mutational Profiles over Survival in Advanced Colorectal Cancer Patients: An Exploratory Study
Abstract
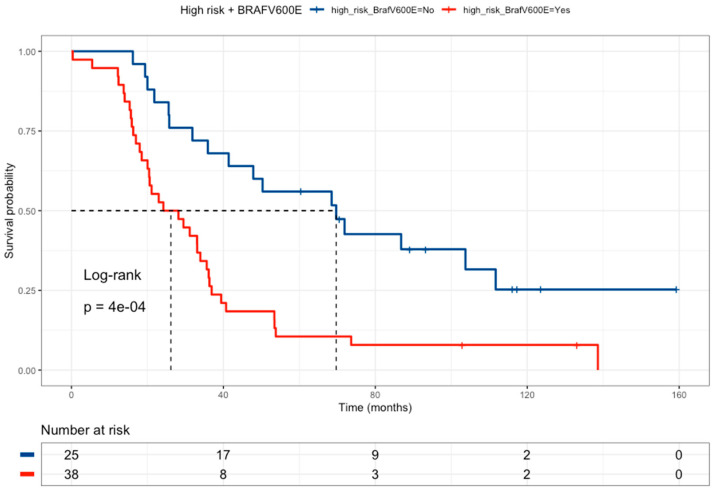
Colorectal cancer is a common disease, both in Chile and worldwide. The most widely used chemotherapy schemes are based on 5-fluorouracil (5FU) as the foundational drug (FOLFOX, CapeOX). Genetic polymorphisms have emerged as potential predictive biomarkers of response to chemotherapy, but conclusive evidence is lacking. This study aimed to investigate the role of genetic variants associated with 5FU-based chemotherapy on therapeutic response, considering their interaction with oncogene mutations (KRAS, NRAS, PI3KCA, AKT1, BRAF). In a retrospective cohort of 63 patients diagnosed with metastatic colorectal cancer, a multivariate analysis revealed that liver metastases, DPYD, ABCB1, and MTHFR polymorphisms are independent indicators of poor prognosis, irrespective of oncogene mutations. BRAF wild-type status and high-risk drug-metabolism polymorphisms correlated with a poor prognosis in this Chilean cohort. Additionally, findings from the genomics of drug sensitivity (GDSC) project demonstrated that cell lines with wild-type BRAF have higher IC50 values for 5-FU compared to BRAF-mutated cell lines. In conclusion, the genetic polymorphisms DPYDrs1801265, ABCB1rs1045642, and MTHFRrs180113 may serve as useful biomarkers for predicting a poor prognosis in patients undergoing 5-fluorouracil chemotherapy, regardless of oncogene mutations.
Keywords: biomarkers; colorectal cancer; pharmacogenomics.
Conflict of interest statement
The authors declare no conflicts of interest.
Figures


Similar articles
-
Effects of KRAS, BRAF, NRAS, and PIK3CA mutations on the efficacy of cetuximab plus chemotherapy in chemotherapy-refractory metastatic colorectal cancer: a retrospective consortium analysis.Lancet Oncol. 2010 Aug;11(8):753-62. doi: 10.1016/S1470-2045(10)70130-3. Epub 2010 Jul 8. Lancet Oncol. 2010. PMID: 20619739
-
Clinicopathologic features and treatment efficacy of Chinese patients with BRAF-mutated metastatic colorectal cancer: a retrospective observational study.Chin J Cancer. 2017 Oct 16;36(1):81. doi: 10.1186/s40880-017-0247-y. Chin J Cancer. 2017. PMID: 29037218 Free PMC article.
-
Retrospective study of RAS/PIK3CA/BRAF tumor mutations as predictors of response to first-line chemotherapy with bevacizumab in metastatic colorectal cancer patients.BMC Cancer. 2017 Jan 9;17(1):38. doi: 10.1186/s12885-016-2994-6. BMC Cancer. 2017. PMID: 28068936 Free PMC article.
-
KRAS, NRAS, BRAF, HER2 and microsatellite instability in metastatic colorectal cancer - practical implications for the clinician.Radiol Oncol. 2019 Sep 24;53(3):265-274. doi: 10.2478/raon-2019-0033. Radiol Oncol. 2019. PMID: 31553708 Free PMC article. Review.
-
The long and winding road to useful predictive factors for anti-EGFR therapy in metastatic colorectal carcinoma: the KRAS/BRAF pathway.Oncology. 2009;77 Suppl 1:57-68. doi: 10.1159/000258497. Epub 2010 Feb 2. Oncology. 2009. PMID: 20130433 Review.
Cited by
-
Understanding microRNA-Mediated Chemoresistance in Colorectal Cancer Treatment.Int J Mol Sci. 2025 Jan 29;26(3):1168. doi: 10.3390/ijms26031168. Int J Mol Sci. 2025. PMID: 39940936 Free PMC article. Review.
-
Can Asiatic Acid from Centella asiatica Be a Potential Remedy in Cancer Therapy?-A Review.Cancers (Basel). 2024 Mar 28;16(7):1317. doi: 10.3390/cancers16071317. Cancers (Basel). 2024. PMID: 38610995 Free PMC article. Review.
References
-
- MINSAL Guía de Práctica Clínica Cáncer Colorectal en Personas de 15 Años y Más. [(accessed on 30 October 2023)]. Available online: https://diprece.minsal.cl/garantias-explicitas-en-salud-auge-o-ges/guias...
-
- National Comprehensive Cancer Network (NCCN) Colon Cancer, Version 2.2023, NCCN Clinical Practice Guidelines in Oncol-ogy. Natl Compr Cancer Netw: JNCCN. [(accessed on 30 October 2023)]. Available online: https://www.nccn.org/professionals/physician_gls/pdf/colon.pdf.
-
- International Agency for Research on Cancer (IARC) Global Cancer Observatory. [(accessed on 30 October 2023)]. Available online: https://gco.iarc.fr/
-
- Sargent D., Sobrero A., Grothey A., O’Connell M.J., Buyse M., Andre T., Zheng Y., Green E., Labianca R., O’Callaghan C., et al. Evidence for Cure by Adjuvant Therapy in Colon Cancer: Observations Based on Individual Patient Data From 20,898 Patients on 18 Randomized Trials. J. Clin. Oncol. 2009;27:872–877. doi: 10.1200/JCO.2008.19.5362. - DOI - PMC - PubMed
Publication types
MeSH terms
Substances
Grants and funding
LinkOut - more resources
Full Text Sources
Medical
Research Materials
Miscellaneous
