. 2023 Dec 30;14(1):36.
doi: 10.3390/brainsci14010036.

Exploring Vitreous Haze as a Potential Biomarker for Accelerated Glymphatic Outflow and Neurodegeneration in Multiple Sclerosis: A Cross-Sectional Study

Affiliations

Exploring Vitreous Haze as a Potential Biomarker for Accelerated Glymphatic Outflow and Neurodegeneration in Multiple Sclerosis: A Cross-Sectional Study

Sezgi Kaçar et al. Brain Sci. .

Abstract

Background: The glymphatic system removes neurodegenerative debris. The ocular glymphatic outflow is from the eye to the proximal optic nerve. In multiple sclerosis (MS), atrophy of the optic nerve increases the glymphatic outflow space. Here, we tested whether vitreous haze (VH) can provide novel insights into the relationship between neurodegeneration and the ocular glymphatic system in MS.

Methods: This cross-sectional study comprised 315 persons with MS and 87 healthy controls (HCs). VH was quantified from optical coherence tomography (OCT) volume scans. Neurodegeneration was determined on three-dimensional T1 (3DT1) MRI, lesion detection on fluid-attenuated inversion (FLAIR), and layer thickness on OCT. Generalized estimating equations, corrected for age, were used to analyze associations between VH and metrics for neurodegeneration, demographics, and clinical scales. Group differences were determined between mild, moderate, and severe disability.

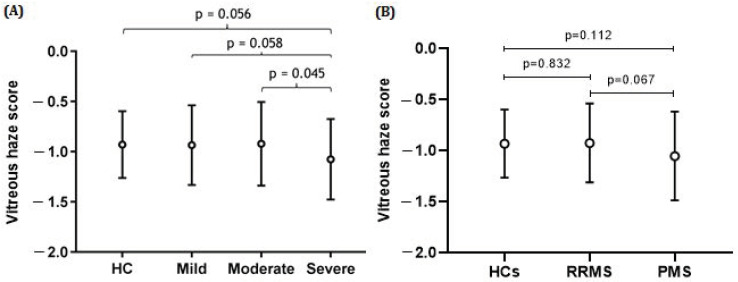
Results: On the group level, VH scores were comparable between MS and control (p = 0.629). In MS, VH scores declined with disease duration (β = -0.009, p = 0.004) and age (β = -0.007, p = 0.001). There was no relation between VH scores and higher age in HCs. In MS patients, VH was related to normalized gray (NGMV, β = 0.001, p = 0.011) and white matter volume (NWMV, β = 0.001, p = 0.003), macular ganglion cell-inner plexiform layer thickness (mGCIPL, β = 0.006, p < 0.001), and peripapillary retinal nerve fiber layer thickness (pRNFL, β = 0.004, p = 0.008). VH was significantly lower in severe compared to mild disability (mean difference -28.86%, p = 0.058).

Conclusions: There is a correlation between VH on OCT and disease duration, more severe disability and lower brain volumes in MS. Biologically, these relationships suggest accelerated glymphatic clearance with disease-related atrophy.

Keywords: glymphatic system; multiple sclerosis; neurodegeneration; optical coherence tomography; vitreous haze.


Conflict of interest statement

All authors declare that they have no relevant potential conflict of interest. The funders had no role in the design of the study; in the collection, analyses, or interpretation of data; in the writing of the manuscript; or in the decision to publish the results.

Figures

Figure 1
Figure 1
The vitreous haze (VH) signal on optical coherence tomography (OCT). An OCT B-scan between the macula and optic disc. The image is optimized by the device developer for viewing on the computer screen such that the retinal layers are clearly visible. The red line shows the A-scan intensity profile in RAW format of the underlying vertical column in the image. Notice how the sharp peaks correspond to the inner segment/outer segment junction and retinal pigment epithelium at Bruch’s membrane complex. The signal from the red line was used to calculate the ratio of the signal intensity inside the vitreous (above the internal limiting membrane (ILM)) to the mean values of the area below. The light blue line, with sharper peaks in the vitreous and below the retina, represents the same profile after contrast adjustment for visualization. Notice how the vitreous signal is artificially increased compared to the retinal signal. In our study, the VH is calculated based on the raw OCT data (red line).
Figure 2
Figure 2
Scatter plots and fitted linear regression lines (with 95% confidence interval) demonstrating the relationship between log-transformed vitreous haze and age (A) or disease duration (B) in MS patients. (A) A significant inverse association was found between vitreous haze and age (β = −0.007, p = 0.001). (B) A significant inverse association was determined between vitreous haze and disease duration (β = −0.009, p = 0.004). β = regression coefficient. All analyses were corrected for age and sex.
Figure 3
Figure 3
Mean vitreous haze scores (±SD) in MS patients categorized according to disease course and level of physical disability and healthy controls (HCs). The strongest effect is observed for the severe end of the disease spectrum. There was no statistical difference between the controls and persons with MS at the milder end of the disease spectrum. (A) The difference in vitreous haze scores between the severe and moderate groups was statistically significant (p = 0.045), while the difference between the severe and mild or severe and HC groups was borderline significant (p = 0.058; p = −0.056). (B) The difference in vitreous haze scores between the HC and PMS groups or between the RRMS and PMS groups was not statistically significant; p = 0.832 and p = 0.067, respectively. All analyses were corrected for age and sex.
Figure 4
Figure 4
Scatter plots and fitted linear regression lines (and 95% confidence interval) demonstrating the relationship between vitreous haze and (A) peripapillary retinal nerve fiber layer thickness (B), macular ganglion cell–inner plexiform layer, (C) gray, and (D) white matter volumes in MS patients. (A) A positive association was found between vitreous haze and pRNFL thickness (β = 0.004, p = 0.008). (B) Likewise, there was a positive relationship between vitreous haze and mGCIPL thickness (β = 0.006, p < 0.001). (C,D) Furthermore, a positive association was found between vitreous haze and both gray as well as white matter volume (β = 0.001, p = 0.011; β = 0.001, p = 0.003, respectively). mGCIPL = macular ganglion cell–inner plexiform layer; pRNFL = peripapillary retinal; β = regression coefficient. All analyses were corrected for age and sex. nerve fiber layer.
Figure 5
Figure 5
Schematic representation of the proposed ocular glymphatic system and an illustration of how impairment of this system leads to a decline in vitreous haze. The arrows indicate the direction of the flow of the ocular glymphatic system. (A) The normal situation is depicted. The endfeet of the Müller cell ensheath retinal arteries and veins, creating perivascular spaces. Likewise, they also form the ILM, which separates the retina from the vitreous. Various transmembrane proteins for the exchange of water and soluble metabolites (e.g., aquaporin-4) are expressed on the astrocytic endfeet. Normally, water enters the retinal tissue from the perivascular space surrounding the retinal arteries. Next, this water exchanges with the interstitial fluid of the retina and picks up metabolites. This fluid, containing the metabolites, then travels to one of three places: (1) the paravascular space surrounding the retinal veins, (2) the vitreous by crossing the ILM, or (3) along the axons of the retinal ganglion cells in the RNFL and the optic nerve. The vitreous haze is caused by metabolites in the vitreous. (B) Impaired glymphatic flow in a neurodegenerative state. Neurodegeneration leads to the loss of polarization of transmembrane protein channels at the site of the astrocytic endfeet. In addition, the loss of axons makes the RNFL and optic nerve more permeable. The first process results in a decreased exchange of water and metabolites across the perivascular membranes and the ILM, resulting in less expulsion of metabolites across the ILM into the vitreous and an accumulation of metabolites in the retinal tissue. Secondly, the higher permeability of the RNFL and optic nerve leads to an accelerated outflow along the axons. As a consequence of both processes, there is a decreased amount of metabolites in the vitreous, and thereby less vitreous haze. ILM = inner limiting membrane; RNFL = retinal nerve fiber layer; GCL = ganglion cell layer; RPE = retinal pigment epithelium.

Similar articles

References

    1. Kamm C.P., Uitdehaag B.M., Polman C.H. Multiple sclerosis: Current knowledge and future outlook. Eur. Neurol. 2014;72:132–141. doi: 10.1159/000360528. - DOI - PubMed
    1. Oh J., Vidal-Jordana A., Montalban X. Multiple sclerosis: Clinical aspects. Curr. Opin. Neurol. 2018;31:752–759. doi: 10.1097/WCO.0000000000000622. - DOI - PubMed
    1. Criste G., Trapp B., Dutta R. Chapter 5—Axonal loss in multiple sclerosis: Causes and mechanisms. In: Goodin D.S., editor. Handbook of Clinical Neurology. Volume 122. Elsevier; Amsterdam, The Netherlands: 2014. pp. 101–113. - PubMed
    1. Amato M.P., Derfuss T., Hemmer B., Liblau R., Montalban X., Soelberg Sørensen P., Miller D.H. Environmental modifiable risk factors for multiple sclerosis: Report from the 2016 ECTRIMS focused workshop. Mult. Scler. J. 2018;24:590–603. doi: 10.1177/1352458516686847. - DOI - PubMed
    1. Walton C., King R., Rechtman L., Kaye W., Leray E., Marrie R.A., Robertson N., La Rocca N., Uitdehaag B., van der Mei I., et al. Rising prevalence of multiple sclerosis worldwide: Insights from the Atlas of MS, third edition. Mult. Scler. 2020;26:1816–1821. doi: 10.1177/1352458520970841. - DOI - PMC - PubMed

LinkOut - more resources