. 2023 Dec 22;14(1):4.
doi: 10.3390/bios14010004.

A Novel Acetone Sensor for Body Fluids

Affiliations

A Novel Acetone Sensor for Body Fluids

Oscar Osorio Perez et al. Biosensors (Basel). .

Abstract

Ketones are well-known biomarkers of fat oxidation produced in the liver as a result of lipolysis. These biomarkers include acetoacetic acid and β-hydroxybutyric acid in the blood/urine and acetone in our breath and skin. Monitoring ketone production in the body is essential for people who use caloric intake deficit to reduce body weight or use ketogenic diets for wellness or therapeutic treatments. Current methods to monitor ketones include urine dipsticks, capillary blood monitors, and breath analyzers. However, these existing methods have certain disadvantages that preclude them from being used more widely. In this work, we introduce a novel acetone sensor device that can detect acetone levels in breath and overcome the drawbacks of existing sensing approaches. The critical element of the device is a robust sensor with the capability to measure acetone using a complementary metal oxide semiconductor (CMOS) chip and convenient data analysis from a red, green, and blue deconvolution imaging approach. The acetone sensor device demonstrated sensitivity of detection in the micromolar-concentration range, selectivity for detection of acetone in breath, and a lifetime stability of at least one month. The sensor device utility was probed with real tests on breath samples using an established blood ketone reference method.

Keywords: breath sensor; digital medicine; fat burning; fat oxidation; ketones; metabolic rate; point of care; wearable sensor.


Conflict of interest statement

Arizona State University owns intellectual property related to the measurement technology: U.S. Patent Application No. 20210048206. T.F. Health Corporation has exclusive license of this patent. Erica Forzani is co-founder of T.F. Health Corporation. Xiaojun Xian is VP of Production of T.F. Health Corporation.

Figures
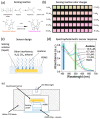
Figure 1
Figure 1
(a) Schematic representation of the acetone sensing reaction involving hydroxylamine and thymol blue. (b) Sensing reaction color changes upon increasing vapor acetone concentrations. (c) Sensor design including hydroxylamine and thymol blue liquid sensing probe and polydimethylsiloxane (PDMS) (Sylgard 184 silicone Elastomer, Midland, MI, USA). (d) Spectrophotometric changes in the acetone sensor before and after exposure to different vapor acetone concentrations. (e) Configuration of the acetone sensor device. The acetone sensor was located between a white LED and a CMOS chip detector, where the light was transmitted through the sensor.
Figure 2
Figure 2
(a) RGB components of the sensor response upon exposure to clean air and acetone obtained with a white light emitting diode (LED), complementary metal oxide semiconductor (CMOS) detector, and Matlab® imaging acquisition performing deconvolution of RGB components. (bd) Sensor calibration curves: G (b), B (c), and total (absolute G and B) (d) sensor signals as a function of acetone vapor concentration. The sensor response was taken at 100% relative humidity and incubation for 3 h at 32 °C. The experiments were repeated in triplicate for each concentration and had a coefficient of variability < 9.1%.
Figure 2
Figure 2
(a) RGB components of the sensor response upon exposure to clean air and acetone obtained with a white light emitting diode (LED), complementary metal oxide semiconductor (CMOS) detector, and Matlab® imaging acquisition performing deconvolution of RGB components. (bd) Sensor calibration curves: G (b), B (c), and total (absolute G and B) (d) sensor signals as a function of acetone vapor concentration. The sensor response was taken at 100% relative humidity and incubation for 3 h at 32 °C. The experiments were repeated in triplicate for each concentration and had a coefficient of variability < 9.1%.
Figure 3
Figure 3
Sensor geometry optimization: Acetone response to different conditions of (a,b) PDMS thickness for a constant volume of liquid sensing probe (2.5 μL), and (c,d) liquid sensing probe volume for a constant thickness (2.0 mm). The sensor response was assessed at an acetone vapor concentration from 2.5 to 40 mMv in (a,c), and of 6.7 mMv in (b,d), using 100% humidity for 3 h. The total sensor response for green (absolute) and blue light components together with the corresponding Langmuir model fitting are shown in (a,c).
Figure 4
Figure 4
Stability test for acetone sensor over time under different configurations of PDMS thickness, liquid sensing probe volumes, and storage temperature conditions. (a) The plot shows the response of the sensors to acetone at a concentration of 6.7 mMv after normalization by the corresponding response assessed on day 1. Each point represents the averaged response for six sensors and the corresponding standard deviation (error bar). The sensor configuration that showed the best stability was the sensor with 2 mm of PDMS thickness and 2.5 μL of liquid sensing probe solution stored at 4 °C for a period of one month. (b) Picture of the sensors after exposure to different temperatures for a period of 30 days.
Figure 5
Figure 5
Interferent selectivity analysis of the liquid probe-based sensor comparing detection of acetone versus volatile organic compounds at concentrations found in human samples. Blue and green light intensity sensor signals for acetone, CO2, ammonia (NH3), and ethanol. The tested ethanol concentration was equivalent to breath ethanol of the “driving-under-influence” threshold condition (0.015 μMv equivalent to 0.0023% v/v). Tested CO2 concentrations were chosen assuming breath (4%) and skin headspace (0.4%) typical concentrations. Tested ammonia concentration was chosen assuming exposure to breath level. Liquid probe-based sensor conditions: 2.0 mm of PDMS thickness, 2.5 μL of sensing probe.
Figure 6
Figure 6
Calibration curves of the liquid probe-based sensor exposed to different concentrations of (a) acetone and (b) CO2. The curves show the calibration equations resulting from the blue and green light intensity components and represent a linear behavior with R2 greater than 0.92. Liquid probe-based sensor conditions: 3.5 mm of PDMS thickness, 2.5 μL of sensing probe.
Figure 7
Figure 7
Correlation of field tests between the measurements of the breath acetone levels assessed with the liquid probe-based sensor and the levels of blood β-hydroxybutyrate assessed with Precision Xtra™ electrochemical capillary blood analyzer from Abbott. Liquid probe-based sensor conditions: 3.5 mm of PDMS thickness, 2.5 μl of sensing probe.

References

    1. Tsow F., Xian X.J., Bridgeman D., Forzani E.S., Tao N.J. Self-Contained Wearable Metabolic Analyzer. US20210378546A1. 2021 December 9;
    1. Forzani E.S., Tao N.J. Metabolic Analyzer. US20130150746. 2013 June 13;
    1. Tsow F., Xian X., Forzani E., Tao N.J. An Improved Portable Metabolic Analyzer System. US10250369795A1. 2015 December 24;
    1. Tao N.J., Forzani E.S. Metabolic Analyzer. U.S. Patent 10,143,401. 2018 December 4;
    1. Tsow F., Xian X.J., Forzani E.S., Tao N.J. Portable Metabolic Analyzer. U.S. Patent 10,078,074. 2018 September 18;

LinkOut - more resources