

Hericium erinaceus Extract Exerts Beneficial Effects on Gut-Neuroinflammaging-Cognitive Axis in Elderly Mice
- PMID: 38248449
- PMCID: PMC10813749
- DOI: 10.3390/biology13010018
Hericium erinaceus Extract Exerts Beneficial Effects on Gut-Neuroinflammaging-Cognitive Axis in Elderly Mice
Abstract
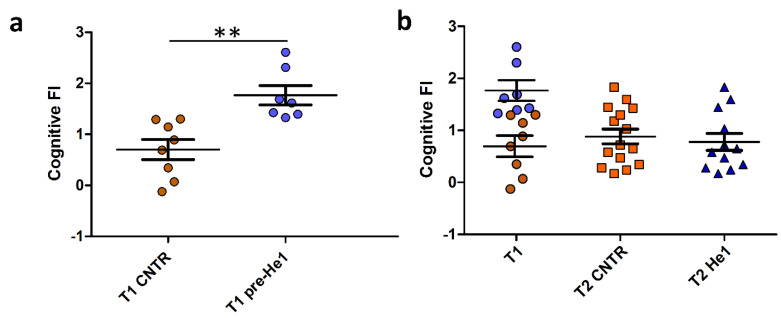
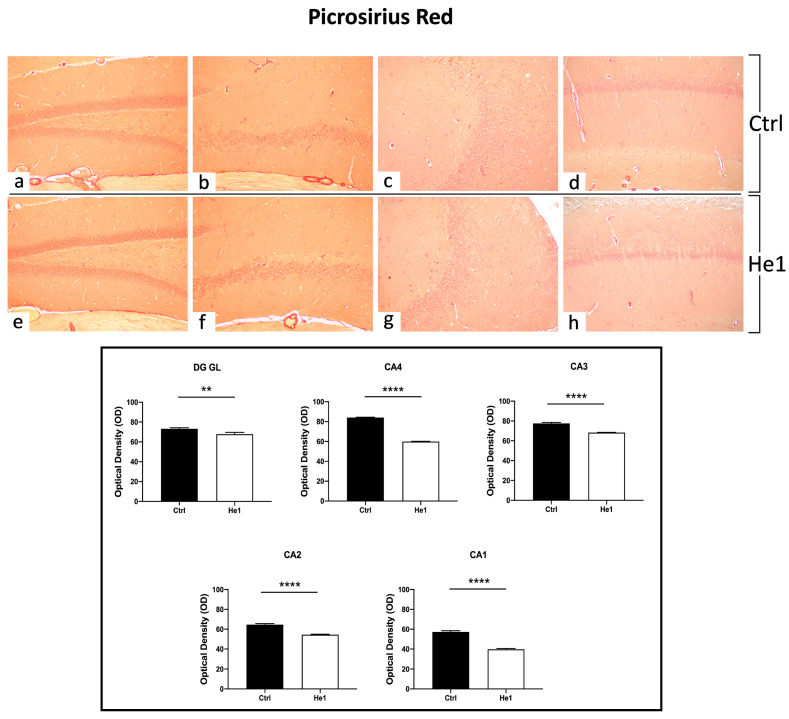
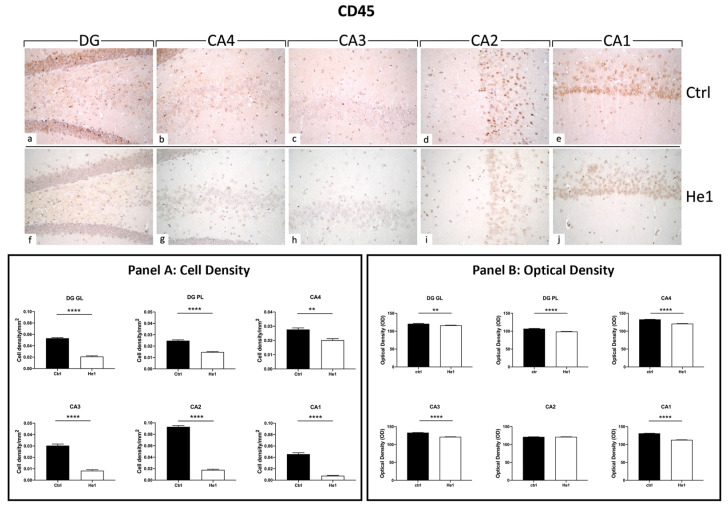
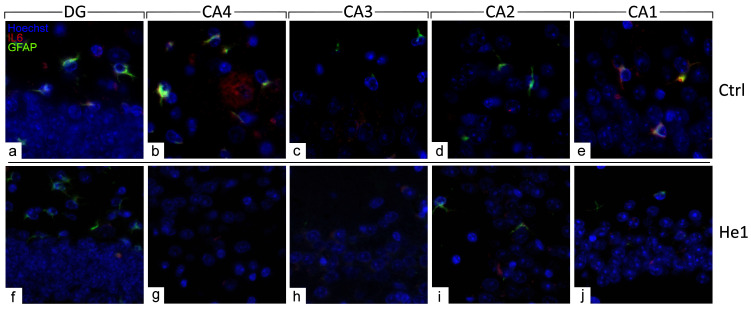
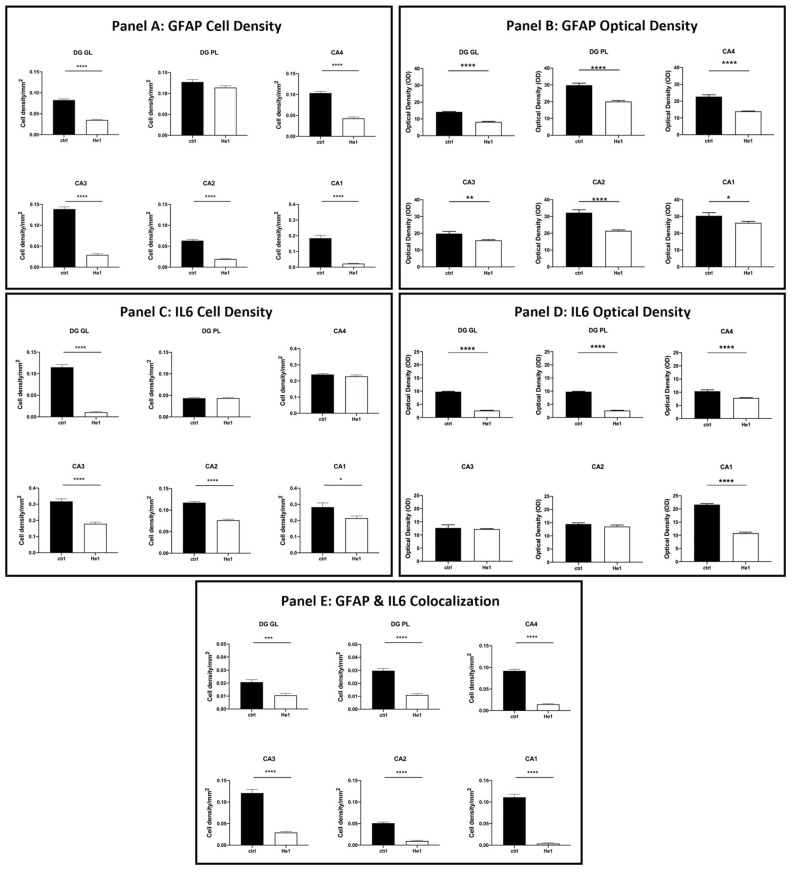
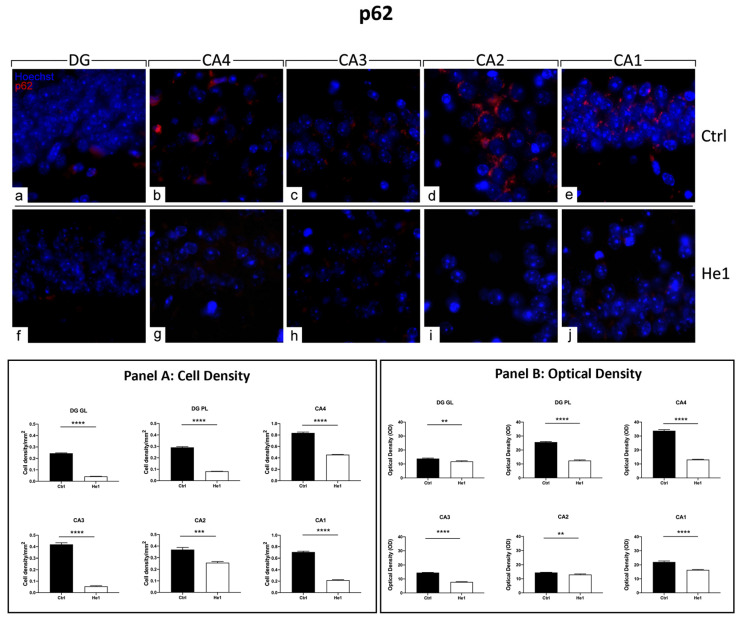
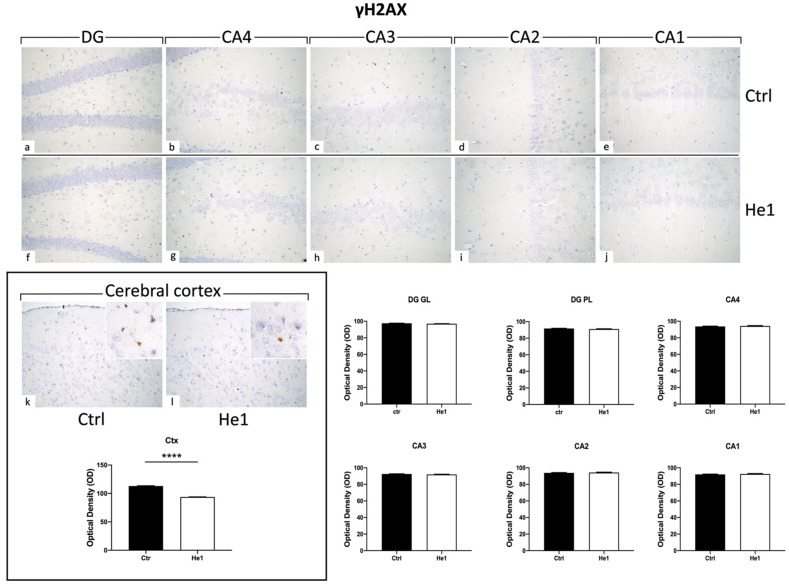
Ageing is a biological phenomenon that determines the impairment of cognitive performances, in particular, affecting memory. Inflammation and cellular senescence are known to be involved in the pathogenesis of cognitive decline. The gut microbiota-brain axis could exert a critical role in influencing brain homeostasis during ageing, modulating neuroinflammation, and possibly leading to inflammaging. Due to their anti-ageing properties, medicinal mushrooms can be utilised as a resource for developing pharmaceuticals and functional foods. Specifically, Hericium erinaceus (He), thanks to its bioactive metabolites, exerts numerous healthy beneficial effects, such as reinforcing the immune system, counteracting ageing, and improving cognitive performance. Our previous works demonstrated the capabilities of two months of He1 standardised extract oral supplementation in preventing cognitive decline in elderly frail mice. Herein, we showed that this treatment did not change the overall gut microbiome composition but significantly modified the relative abundance of genera specifically involved in cognition and inflammation. Parallelly, a significant decrease in crucial markers of inflammation and cellular senescence, i.e., CD45, GFAP, IL6, p62, and γH2AX, was demonstrated in the dentate gyrus and Cornus Ammonis hippocampal areas through immunohistochemical experiments. In summary, we suggested beneficial and anti-inflammatory properties of He1 in mouse hippocampus through the gut microbiome-brain axis modulation.
Keywords: Hericium erinaceus; ageing; frailty; gut microbiota; gut–brain axis; hippocampus; neuroinflammaging.
Conflict of interest statement
The authors declare no conflict of interest.
Figures


Similar articles
-
Cognitive Healthy Aging in Mice: Boosting Memory by an Ergothioneine-Rich Hericium erinaceus Primordium Extract.Biology (Basel). 2023 Jan 28;12(2):196. doi: 10.3390/biology12020196. Biology (Basel). 2023. PMID: 36829475 Free PMC article.
-
Searching for a Longevity Food, We Bump into Hericium erinaceus Primordium Rich in Ergothioneine: The "Longevity Vitamin" Improves Locomotor Performances during Aging.Nutrients. 2022 Mar 11;14(6):1177. doi: 10.3390/nu14061177. Nutrients. 2022. PMID: 35334834 Free PMC article.
-
Influence of Short-Term Consumption of Hericium erinaceus on Serum Biochemical Markers and the Changes of the Gut Microbiota: A Pilot Study.Nutrients. 2021 Mar 21;13(3):1008. doi: 10.3390/nu13031008. Nutrients. 2021. PMID: 33800983 Free PMC article.
-
Antitumor, Anti-Inflammatory and Antiallergic Effects of Agaricus blazei Mushroom Extract and the Related Medicinal Basidiomycetes Mushrooms, Hericium erinaceus and Grifola frondosa: A Review of Preclinical and Clinical Studies.Nutrients. 2020 May 8;12(5):1339. doi: 10.3390/nu12051339. Nutrients. 2020. PMID: 32397163 Free PMC article. Review.
-
The potential therapeutic role of Hericium erinaceus extract in pathologic conditions involving the urogenital-gut axis: insights into the involved mechanisms and mediators.J Physiol Pharmacol. 2024 Feb;75(1). doi: 10.26402/jpp.2024.1.01. Epub 2024 Apr 3. J Physiol Pharmacol. 2024. PMID: 38583434 Review.
Cited by
-
Exploring the Connections: Autophagy, Gut Microbiota, and Inflammatory Bowel Disease Pathogenesis.J Inflamm Res. 2024 Dec 5;17:10453-10470. doi: 10.2147/JIR.S483958. eCollection 2024. J Inflamm Res. 2024. PMID: 39654856 Free PMC article. Review.
-
Osteogenesis Imperfecta: A Look into the Cerebellum of the Brtl Murine Model.Mol Neurobiol. 2025 Jul 22. doi: 10.1007/s12035-025-05205-9. Online ahead of print. Mol Neurobiol. 2025. PMID: 40694281
-
Macrophages and Gut Barrier Function: Guardians of Gastrointestinal Health in Post-Inflammatory and Post-Infection Responses.Int J Mol Sci. 2024 Aug 30;25(17):9422. doi: 10.3390/ijms25179422. Int J Mol Sci. 2024. PMID: 39273369 Free PMC article. Review.
-
Hericium erinaceus Protein Alleviates High-Fat Diet-Induced Hepatic Lipid Accumulation and Oxidative Stress In Vivo.Foods. 2025 Jan 31;14(3):459. doi: 10.3390/foods14030459. Foods. 2025. PMID: 39942052 Free PMC article.
-
Unveiling the Chemical Composition and Biofunctionality of Hericium spp. Fungi: A Comprehensive Overview.Int J Mol Sci. 2024 May 29;25(11):5949. doi: 10.3390/ijms25115949. Int J Mol Sci. 2024. PMID: 38892137 Free PMC article. Review.
References
-
- Kelaiditi E., Cesari M., Canevelli M., van Kan G.A., Ousset P.-J., Gillette-Guyonnet S., Ritz P., Duveau F., Soto M.E., Provencher V., et al. Cognitive Frailty: Rational and Definition from an (I.A.N.A./I.A.G.G.) International Consensus Group. J. Nutr. Health Aging. 2013;17:726–734. doi: 10.1007/s12603-013-0367-2. - DOI - PubMed
Grants and funding
LinkOut - more resources
Full Text Sources
Research Materials
Miscellaneous
