. 2023 Dec 29;14(1):23.
doi: 10.3390/metabo14010023.

The Detection of Primary Sclerosing Cholangitis Using Volatile Metabolites in Fecal Headspace and Exhaled Breath

Affiliations

The Detection of Primary Sclerosing Cholangitis Using Volatile Metabolites in Fecal Headspace and Exhaled Breath

Robert van Vorstenbosch et al. Metabolites. .

Abstract

Up to 5% of inflammatory bowel disease patients may at some point develop primary sclerosing cholangitis (PSC). PSC is a rare liver disease that ultimately results in liver damage, cirrhosis and liver failure. It typically remains subclinical until irreversible damage has been inflicted. Hence, it is crucial to screen IBD patients for PSC, but its early detection is challenging, and the disease's etiology is not well understood. This current study aimed at the early detection of PSC in an IBD population using Volatile Organic Compounds in fecal headspace and exhaled breath. To this aim, fecal material and exhaled breath were collected from 73 patients (n = 16 PSC/IBD; n = 8 PSC; n = 49 IBD), and their volatile profile were analyzed using Gas Chromatography-Mass Spectrometry. Using the most discriminatory features, PSC detection resulted in areas under the ROC curve (AUCs) of 0.83 and 0.84 based on fecal headspace and exhaled breath, respectively. Upon data fusion, the predictive performance increased to AUC 0.92. The observed features in the fecal headspace relate to detrimental microbial dysbiosis and exogenous exposure. Future research should aim for the early detection of PSC in a prospective study design.

Keywords: early detection; exhaled breath; fecal headspace; inflammatory bowel disease; liver disease; metabolomics; primary sclerosing cholangitis; volatile organic compounds.


Conflict of interest statement

The authors declare no conflicts of interest related to the current study. AS is an assistant professor at Maastricht University and is an advisor at Owlstone Medical (Cambridge, UK), a breath-based medical company aiming for the non-invasive detection of diseases.

Figures

Figure 1
Figure 1
The concept of log ratios explained. To eliminate size effects (or dilution effects), internal ratios can be considered to omit the need for normalization. Here, the internal ratios of the original features are calculated.
Figure 2
Figure 2
Flow chart of the data analysis procedure of the classification model. First, upon multiple imputations and the calculation of the respective log ratios and shadow features, feature importance values are calculated in 500 iterations. Then, the frequencies of each log ratio with an importance higher than 40% of the maximum importance for the respective iteration is determined. Those that have smaller frequencies than the maximum of the shadow features are penalized and reduced to zero. After this, the squared feature-feature matrix is visualized, with the most important features being visualized first. The exact features to be included are optimized, and a final model is built using only those selected features in 500 iterations.
Figure 3
Figure 3
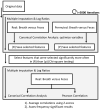
Flow chart of the data analysis procedure to calculate correlations between platforms. Due to the randomized multiple imputations needed for the data processing of the fecal headspace, multiple imputations were used. Upon calculating those, breath and fecal metabolic profiles were correlated using canonical correlation analysis combined with recursive feature elimination until significance was reached. The same procedure was performed on randomly permuted data. Next, chi-square test was applied to determine which features were selected significantly more often in the real versus the permuted data set. Based on only these features, the multivariate and univariate correlations were determined. A similar approach was followed to correlate fecal and exhaled breath profiles to blood markers AST, ALT, ALP and bilirubin.
Figure 4
Figure 4
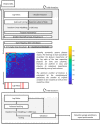
(A) Principal Coordinate Score plot resulting from unsupervised random forest. Fecal headspace samples (blue) are clearly separated from microchamber blanks (red) and instrumental blanks (i.e., GC-MS, yellow). Moreover, clear overlap is seen between microchamber and instrumental blanks. Altogether, these results show that indeed the subsequent data analyses were based on VOCs truly coming from fecal headspace with reasonable certainty. (B) The predictions of the IBD population are classified as IBD. On the x-axis, the deviation from average fecal water content (74%) is shown. As observed, either dry (i.e., more constipated) or wet (i.e., diarrhea) samples lowered the certainty of predictions.
Figure 5
Figure 5
(A) Principal Coordinate Score plot based on the OOB fraction of RF to discriminate PSC (blue) from IBD (red) based on the volatile profile of fecal headspace. (B) Similar score plot to discriminate PSC from IBD based on exhaled breath. (C) Similar score plot to discriminate PSC from IBD based on data fusion of the results from fecal headspace and exhaled breath. Here, data fusion was performed by proximity stacking. (D) ROC curves for the predictions based on fecal water content (blue), fecal headspace (red), exhaled breath (yellow) and the fusion of exhaled breath with fecal headspace (purple).
Figure 6
Figure 6
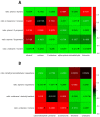
(A) Univariate correlations between exhaled breath volatiles (x-axis) and fecal headspace (y-axis) for the PSC population. (B) Univariate correlations between exhaled breath volatiles (x-axis) and fecal headspace (y-axis) for the IBD population. Significant correlations (p < 0.05) are marked using *. Note: upon Benjamin Hochberg correction, no correlation retained significance.
Figure 7
Figure 7
Mechanistic overview of the potential Volatile Metabolic markers in fecal headspace. In general, markers could be subdivided into those related to exposure, gut microbiome dysbiosis, reduced gut barrier integrity, oxidative stress and those repeatedly observed in other studies. Here, styrene, isopentane and toluene could be related to exposure through foods and beverages. Limonene, usually considered an exogenous VOC, could be related to gut microbial dynamics or to exposure. A known marker for gut dysbiosis is indole, with increased concentrations reflecting more beneficial homeostasis compared to decreased concentrations reflecting dysbiosis. Such dysbiosis is reflected in numerous VOCs, including phenol, 2-propanol, methyl caproate and secbutyl-carbinol, that are thought to be linked to numerous microbial species related to PSC. Isobutyric acid is a known VOC related to detrimental proteolytic fermentation, breaking interstitial bonds between epithelial cells, causing “leakage” of pathogens and their associated metabolic products via the portal vein to the liver. One major microbial metabolic constituent is ethanol produced by the gut microbiota, which is proven to be hepatotoxic. As a result, systemic oxidative stress increases, reflected by several alkanes and aldehydes. Also, due to liver damage, traditional blood markers for liver degradation are increased (ALT, AST, ALP and bilirubin). Due to blockage of the biliary ducts, metabolic waste products of the liver cannot properly exit and accumulate. This process increases concentrations of hepatotoxic compounds in the liver. Moreover, by blocking passage of primary bile acids to the gut microbiome, its dysbiosis is strengthened. Lastly, 2-pentanone and 2-hexanone are markers of inflammatory bowel disease that have been repeatedly observed across studies.

Similar articles

Cited by

References

    1. Karlsen T.H., Folseraas T., Thorburn D., Vesterhus M. Primary sclerosing cholangitis—A comprehensive review. J. Hepatol. 2017;67:1298–1323. doi: 10.1016/j.jhep.2017.07.022. - DOI - PubMed
    1. Razumilava N., Gores G.J. Surveillance for cholangiocarcinoma in patients with primary sclerosing cholangitis: Effective and justified? Clin. Liver Dis. 2016;8:43–47. doi: 10.1002/cld.567. - DOI - PMC - PubMed
    1. Huang Y., Zhang S., Weng J.-F., Huang D., Gu W.-L. Recent discoveries in microbiota dysbiosis, cholangiocytic factors, and models for studying the pathogenesis of primary sclerosing cholangitis. Open Med. 2022;17:915–929. doi: 10.1515/med-2022-0481. - DOI - PMC - PubMed
    1. Dyson J.K., Beuers U., Jones D.E.J., Lohse A.W., Hudson M. Primary sclerosing cholangitis. Lancet. 2018;391:2547–2559. doi: 10.1016/S0140-6736(18)30300-3. - DOI - PubMed
    1. Mjelle A.B., Fossdal G., Gilja O.H., Vesterhus M. Liver Elastography in Primary Sclerosing Cholangitis Patients Using Three Different Scanner Systems. Ultrasound Med. Biol. 2020;46:1854–1864. doi: 10.1016/j.ultrasmedbio.2020.03.025. - DOI - PubMed

LinkOut - more resources