. 2023 Dec 29;14(1):24.
doi: 10.3390/metabo14010024.

Bayesian 13C-Metabolic Flux Analysis of Parallel Tracer Experiments in Granulocytes: A Directional Shift within the Non-Oxidative Pentose Phosphate Pathway Supports Phagocytosis

Affiliations

Bayesian 13C-Metabolic Flux Analysis of Parallel Tracer Experiments in Granulocytes: A Directional Shift within the Non-Oxidative Pentose Phosphate Pathway Supports Phagocytosis

Melanie Hogg et al. Metabolites. .

Abstract

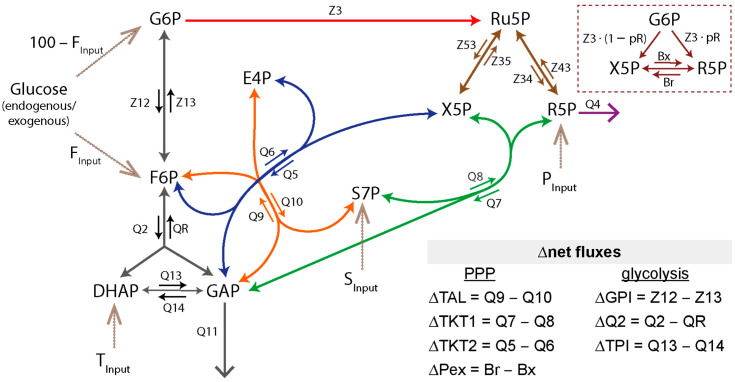
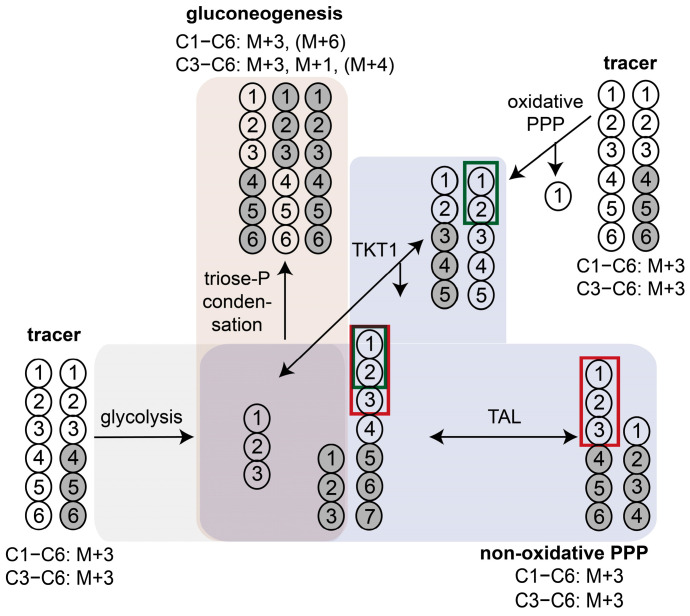
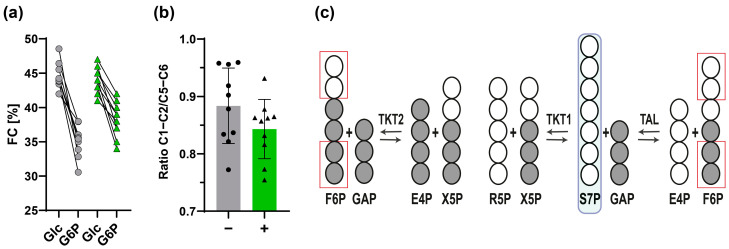
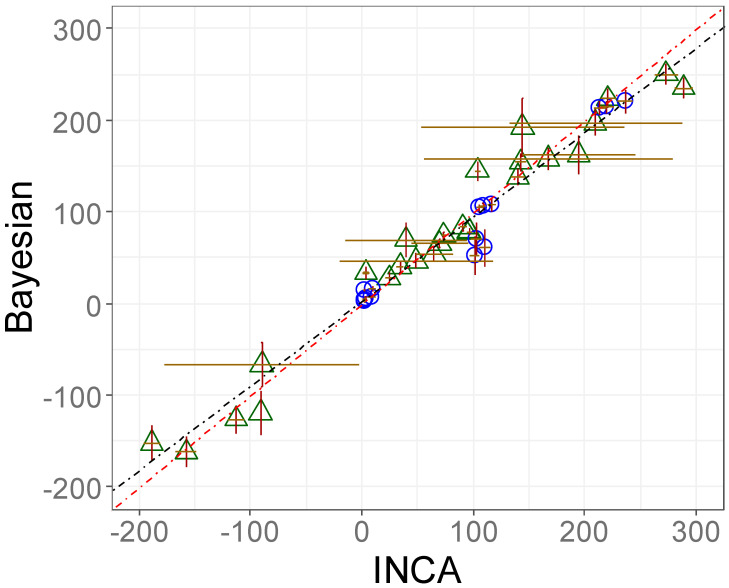
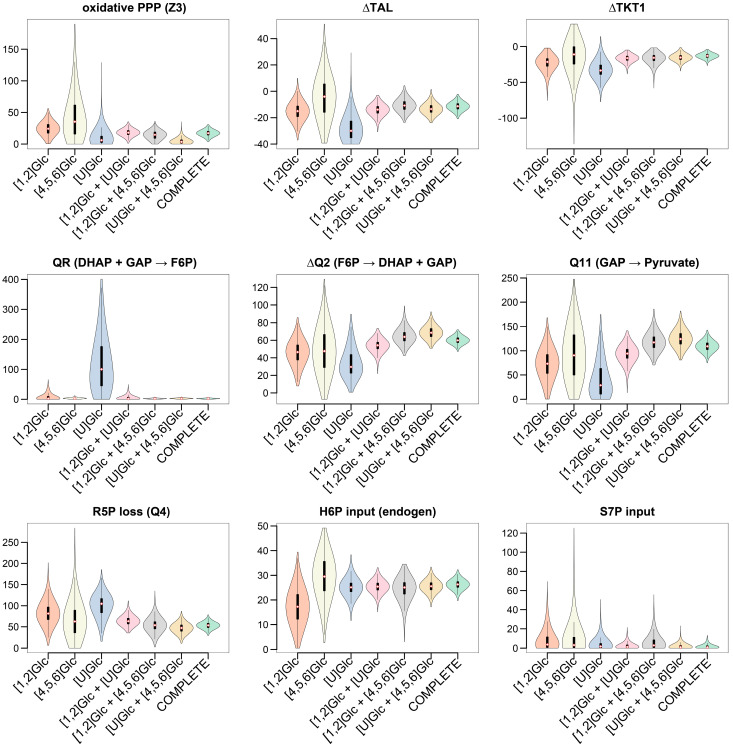
The pentose phosphate pathway (PPP) plays a key role in the cellular regulation of immune function; however, little is known about the interplay of metabolic adjustments in granulocytes, especially regarding the non-oxidative PPP. For the determination of metabolic mechanisms within glucose metabolism, we propose a novel set of measures for 13C-metabolic flux analysis based on ex vivo parallel tracer experiments ([1,2-13C]glucose, [U-13C]glucose, [4,5,6-13C]glucose) and gas chromatography-mass spectrometry labeling measurements of intracellular metabolites, such as sugar phosphates and their fragments. A detailed constraint analysis showed that the permission range for net and irreversible fluxes was limited to a three-dimensional space. The overall workflow, including its Bayesian flux estimation, resulted in precise flux distributions and pairwise confidence intervals, some of which could be represented as a line due to the strength of their correlation. The principal component analysis that was enabled by these behaviors comprised three components that explained 99.6% of the data variance. It showed that phagocytic stimulation reversed the direction of non-oxidative PPP net fluxes from ribose-5-phosphate biosynthesis toward glycolytic pathways. This process was closely associated with the up-regulation of the oxidative PPP to promote the oxidative burst.

Keywords: Bayesian modeling; gas chromatography–mass spectrometry; glucose metabolism; immunometabolism; isotopic tracer; mass isotopomer distribution analysis; metabolic model validation; phagocytose; principal component analysis; sugar phosphates.


Conflict of interest statement

The authors declare no conflicts of interest. The funders had no role in the design of the study; in the collection, analyses, or interpretation of data; in the writing of the manuscript; or in the decision to publish the results.

Figures

Figure 1
Figure 1
Metabolic network of the upper glucose metabolism for 13C-MFA. Fluxes were normalized to a glucose uptake rate of 100 into the combined F6P and G6P pool. Top right side: reduced system of the exchange between the pentose phosphate pool. Color code for fluxes: red: oxidative PPP, brown: pentose phosphate exchange, purple: R5P loss, green/blue: TKT1/2 reactions, orange: TAL reaction, black: glycolysis. The dashed lines indicate an input into the system, with PInput, SInput, and TInput being unlabeled carbon sources. Abbr.: TAL: transaldolase, TKT: transketolase, Pex: pentose phosphate exchange, GPI: glucose-phosphate isomerase, TPI: triose-phosphate isomerase, metabolite abbr.: see Supplementary file: Bayes_implementation.pdf.
Figure 2
Figure 2
GC−EI−MS spectrum of G6P as an EtOx-TMS derivative (70 eV).
Figure 3
Figure 3
13C labeling patterns obtained from parallel tracer experiments with [1,2-13C]glucose (ac,f), [U-13C]glucose (d) and [4,5,6-13C]glucose (e) of resting granulocytes (gray bars, black circle) and granulocytes after stimulation with E. coli bioparticles (green bars, black triangles). Mass isotopomer distributions were corrected for natural isotope abundance. Bar graphs are displayed as mean ± sd of n = 10 biological replicates.
Figure 4
Figure 4
Utilization of [4,5,6-13C]glucose for the assessment of triose-phosphate condensation (gluconeogenesis). Metabolization of [4,5,6-13C]glucose via the pentose phosphate pathway produces M+3 labeling patterns on G6P (both fragments: C1−C6/C3−C6). The transaldolase/transketolase reactions only involve the upper carbon atoms (C1−C3) (shown with red and green borders), so that no 13C labeling is transferred from the lower half to the upper half. In contrast, triose-phosphate condensation leads to either M+3/M+6 for fragment C1–C6 or M+3/M+1/M+4 for fragment C3–C6. Due to the excess of unlabeled trioses compared to labeled trioses (3:1), the probability that both trioses are simultaneously labeled during glucose formation is low (M+4 and M+6 labeling, respectively). Abbr.: triose-P: triose-phosphate; TKT1: transketolase 1; TAL: transaldolase; PPP: pentose phosphate pathway.
Figure 5
Figure 5
13C enrichment analysis of [U-13C]glucose tracer experiments. (a) Fractional contribution (FC) of glucose (Glc) (m/z 568) and G6P (m/z 720) from untreated (gray circle) and E. coli bioparticle-stimulated granulocytes (green triangle), n = 10. (b) Ratio of total 13C enrichment in C1−C2 to the total 13C enrichment in C5−C6 of G6P obtained from untreated (gray bars, black circle) and E. coli-stimulated granulocytes (green bars, black triangle). Bar graphs are displayed as mean ± sd of n = 10 biological replicates. The individual values are indicated by dots. (c) Reactions within the non-oxidative PPP: an unlabeled S7P input leads to increased 13C enrichment in the lower position (C5−C6) of H6P in contrast to the upper carbon atoms (C1−C2). Dark circles indicate 13C atoms, while empty circles represent 12C atoms.
Figure 6
Figure 6
13C-MFA results of our Bayesian 13C-MFA in comparison with the 13C-MFA results published by Britt et al. estimated with the INCA software. Both MFA approaches utilized the same LC−MS 13C labeling data of Britt et al. Symbols represent mean ± sd of individual fluxes (∑8) of 8 samples (∑64 data points). Green triangles: PMA-stimulated neutrophils, blue circles: PMA + DPI-stimulated neutrophils, brown error bars: horizontal, dark red error bars: vertical, red dotted line: y = x, black dotted line: linear regression y = 0.92x + 2.78 (R2 = 0.958).
Figure 7
Figure 7
13C-MFA using all 13C labeling data (7 fragments, 4 metabolites) of individual tracer experiments and combined 13C-MFA of two to three tracers (complete 13C-MFA). Fluxes were normalized to a glucose uptake rate of 100. Results were obtained from a synthetic isotopomer data set. Violin plots represent a combination of box plot and kernel density plot. The median is highlighted as a white-filled diamond with red border. Black bars represent the interquartile range (IQR) (first and third quartile). The lower/upper adjacent values are defined as first quartile −1.5 IQR or third quartile + 1.5 IQR, respectively. They are visualized as thinner black lines extending from the IQR. The width of the violin plot reflects the frequency of data points. Oxidative PPP: Z3; non-oxidative PPP: ∆TAL, ∆TKT1, Q4 (R5P loss); condensation of triose phosphates: QR; glycolytic fluxes: ∆Q2 (triose phosphate formation), Q11 (glycolytic triose utilization).
Figure 8
Figure 8
13C-MFA with 3PG labeling data (C1−C3) compared to (i) additional G6P labeling data of individual fragments (C1−C6, C3−C6, C5−C6). The star symbol in the set description indicates that the measurement precision of G6P(C1−C6) was set to a value equivalent to the GC−MS precision of G6P fragments C3−C6 and C5-C6. (ii) A combination of all three G6P fragments additional to 3PG. (iii) A combination of 3PG, DHAP, and all three G6P fragments, and (iv) a complete MFA (3PG, DHAP, P5P, G6P, ∑7 fragments). Results were obtained from a synthetic isotopomer data set derived from parallel tracer experiments with [4,5,6-13C]glucose, [U-13C]glucose, and [1,2-13C]glucose. Fluxes were normalized to a glucose uptake rate of 100. Violin plots represent a combination of box plots and kernel density plots, and the median is highlighted by a white-filled diamond with a red border. Black bars represent the interquartile range (IQR) (first and third quartile). The lower/upper adjacent values are defined as first quartile −1.5 IQR or third quartile +1.5 IQR, respectively. They are visualized as thinner black lines extending from the IQR. The width of the violin plot reflects the frequency of data points. Oxidative PPP: Z3; non-oxidative PPP: ∆TAL, ∆TKT1, Q4 (R5P loss); condensation of triose phosphates: QR; glycolytic fluxes: ∆Q2 (triose phosphate formation), Q11 (glycolytic triose utilization).
Figure 9
Figure 9
Precision scores for the given parallel tracer experiment ([1,2-13C]glucose, [U-13C]glucose, and [4,5,6-13C]glucose) while using different metabolites/fragments for 13C-MFA. The precision scores of the reference experiment (only 3PG labeling data) is 1 by definition and indicated by a red dotted line. The star symbol in the set description indicates that the reduced measurement precision of G6P (C1−C6) was set to a value equivalent to the GC−MS precision of G6P fragments C3−C6 and C5−C6.
Figure 10
Figure 10
13C-MFA results of untreated granulocytes (−) (gray bars, black circles) and granulocytes stimulated with E. coli bioparticles (+) (green bars, black triangles). Fluxes were normalized to a glucose uptake rate of 100. Bar graphs show median with interquartile range of each group (n = 10). Individual symbols show posterior mean from Bayesian 13C-MFA. Statistical analysis was performed with the Mann–Whitney test (**** = p < 0.0001, *** = p = 0.0003, ** = p = 0.0089, * = p = 0.0232). Oxidative PPP: Z3; non-oxidative PPP: ∆TAL, ∆TKT1, Q4 (R5P loss), pentose phosphate (P5P) exchange; glycolytic fluxes: ∆Q2 (triose phosphate formation), Q11 (glycolytic triose utilization), ∆GPI, ∆TPI.
Figure 11
Figure 11
Relations between fluxes of the upper glucose metabolism. Results of the 13C-MFA are displayed as an ellipse with their 68% confidence interval (±one standard deviation of the mean). Dark blue ellipses with yellow circles indicate untreated granulocytes (n = 10), green ellipses with red triangles granulocytes stimulated with E. coli bioparticles (n = 10), light blue ellipses with beige circles PMA + DPI-stimulated neutrophils (n = 3), and green ellipses with magenta triangles PMA-stimulated neutrophils (n = 5). Symbols indicate the posterior mean of 13C-MFA data sets. 13C-MFA of granulocytes was performed with 13C labeling data obtained from parallel tracer experiments and subsequent GC−MS measurements. Neutrophil data were obtained by applying our 13C-MFA routine to LC−MS data from the recent publication of Britt et al. The gray area represents the valid range based on the model structure without fitting of 13C labeling data. In the center graph at the top right, we added the PCA score plot of the first two principal components for comparison. The red dotted line indicates the separation between stimulated granulocytes and non-activated granulocytes. Oxidative PPP: Z3; non-oxidative PPP: ∆TAL, ∆TKT1, Q4 (R5P loss); glycolytic fluxes: ∆Q2 (triose phosphate formation), Q11 (glycolytic triose utilization).
Figure 12
Figure 12
Metabolic states of granulocytes/neutrophils identified by the first three principal components (PC) of PCA exploring 13C-MFA data (n = 28, ∑fluxes = 9). Contribution of each PC to the total variance indicated within parenthesis. The first three PCs amounted to ~99.6% of the variance.

Similar articles

Cited by

References

    1. Kumar S., Dikshit M. Metabolic Insight of Neutrophils in Health and Disease. Front. Immunol. 2019;10:2099. doi: 10.3389/fimmu.2019.02099. - DOI - PMC - PubMed
    1. Toller-Kawahisa J.E., O’Neill L.A.J. How neutrophil metabolism affects bacterial killing. Open Biol. 2022;12:220248. doi: 10.1098/rsob.220248. - DOI - PMC - PubMed
    1. Britt E.C., Lika J., Giese M.A., Schoen T.J., Seim G.L., Huang Z., Lee P.Y., Huttenlocher A., Fan J. Switching to the cyclic pentose phosphate pathway powers the oxidative burst in activated neutrophils. Nat. Metab. 2022;4:389–403. doi: 10.1038/s42255-022-00550-8. - DOI - PMC - PubMed
    1. Paclet M.-H., Laurans S., Dupré-Crochet S. Regulation of Neutrophil NADPH Oxidase, NOX2: A Crucial Effector in Neu-trophil Phenotype and Function. Front. Cell Dev. Biol. 2022;10:945749. doi: 10.3389/fcell.2022.945749. - DOI - PMC - PubMed
    1. TeSlaa T., Ralser M., Fan J., Rabinowitz J.D. The pentose phosphate pathway in health and disease. Nat. Metab. 2023;5:1275–1289. doi: 10.1038/s42255-023-00863-2. - DOI - PMC - PubMed

LinkOut - more resources