

Ethnic Disparities in Lipid Metabolism and Clinical Outcomes between Dutch South Asians and Dutch White Caucasians with Type 2 Diabetes Mellitus
- PMID: 38248836
- PMCID: PMC10819672
- DOI: 10.3390/metabo14010033
Ethnic Disparities in Lipid Metabolism and Clinical Outcomes between Dutch South Asians and Dutch White Caucasians with Type 2 Diabetes Mellitus
Abstract
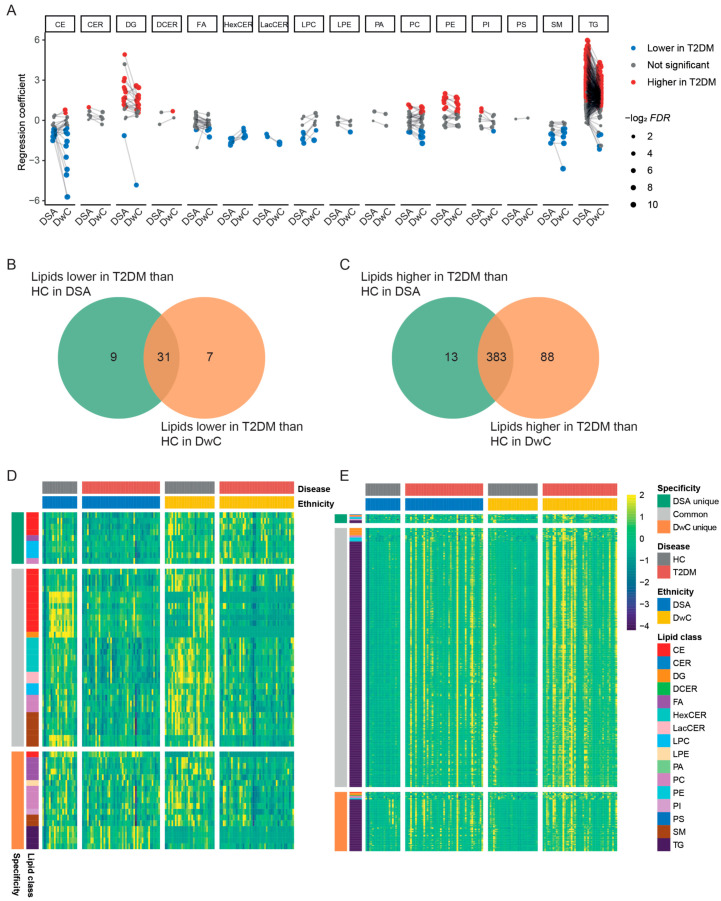
Type 2 diabetes mellitus (T2DM) poses a higher risk for complications in South Asian individuals compared to other ethnic groups. To shed light on potential mediating factors, we investigated lipidomic changes in plasma of Dutch South Asians (DSA) and Dutch white Caucasians (DwC) with and without T2DM and explore their associations with clinical features. Using a targeted quantitative lipidomics platform, monitoring over 1000 lipids across 17 classes, along with 1H NMR based lipoprotein analysis, we studied 51 healthy participants (21 DSA, 30 DwC) and 92 T2DM patients (47 DSA, 45 DwC) from the MAGNetic resonance Assessment of VICTOza efficacy in the Regression of cardiovascular dysfunction in type 2 dIAbetes mellitus (MAGNA VICTORIA) study. This comprehensive mapping of the circulating lipidome allowed us to identify relevant lipid modules through unbiased weighted correlation network analysis, as well as disease and ethnicity related key mediatory lipids. Significant differences in lipidomic profiles, encompassing various lipid classes and species, were observed between T2DM patients and healthy controls in both the DSA and DwC populations. Our analyses revealed that healthy DSA, but not DwC, controls already exhibited a lipid profile prone to develop T2DM. Particularly, in DSA-T2DM patients, specific lipid changes correlated with clinical features, particularly diacylglycerols (DGs), showing significant associations with glycemic control and renal function. Our findings highlight an ethnic distinction in lipid modules influencing clinical outcomes in renal health. We discover distinctive ethnic disparities of the circulating lipidome and identify ethnicity-specific lipid markers. Jointly, our discoveries show great potential as personalized biomarkers for the assessment of glycemic control and renal function in DSA-T2DM individuals.
Keywords: Dutch South Asian; Dutch white Caucasian; diabetic nephropathy; lipidomics; type 2 diabetes mellitus.
Conflict of interest statement
The authors declare that they have no relevant financial interests or personal relationships.
Figures


Similar articles
-
Altered high-density lipoprotein composition is associated with risk for complications in type 2 diabetes mellitus in South Asian descendants: A cross-sectional, case-control study on lipoprotein subclass profiling.Diabetes Obes Metab. 2023 Aug;25(8):2374-2387. doi: 10.1111/dom.15118. Epub 2023 May 18. Diabetes Obes Metab. 2023. PMID: 37202875
-
Serum lipidomics profiles reveal potential lipid markers for prediabetes and type 2 diabetes in patients from multiple communities.Front Endocrinol (Lausanne). 2022 Aug 15;13:966823. doi: 10.3389/fendo.2022.966823. eCollection 2022. Front Endocrinol (Lausanne). 2022. PMID: 36060983 Free PMC article.
-
Brown adipose tissue volume in healthy lean south Asian adults compared with white Caucasians: a prospective, case-controlled observational study.Lancet Diabetes Endocrinol. 2014 Mar;2(3):210-7. doi: 10.1016/S2213-8587(13)70156-6. Epub 2013 Nov 12. Lancet Diabetes Endocrinol. 2014. PMID: 24622751
-
Obesity-related non-communicable diseases: South Asians vs White Caucasians.Int J Obes (Lond). 2011 Feb;35(2):167-87. doi: 10.1038/ijo.2010.135. Epub 2010 Jul 20. Int J Obes (Lond). 2011. PMID: 20644557 Review.
-
Epidemiology of diabetes among South Asians in the United States: lessons from the MASALA study.Ann N Y Acad Sci. 2021 Jul;1495(1):24-39. doi: 10.1111/nyas.14530. Epub 2020 Nov 20. Ann N Y Acad Sci. 2021. PMID: 33216378 Free PMC article. Review.
References
Grants and funding
LinkOut - more resources
Full Text Sources
