. 2024 Jan 13;14(1):51.
doi: 10.3390/metabo14010051.

Integrating TCGA and Single-Cell Sequencing Data for Hepatocellular Carcinoma: A Novel Glycosylation (GLY)/Tumor Microenvironment (TME) Classifier to Predict Prognosis and Immunotherapy Response

Affiliations

Integrating TCGA and Single-Cell Sequencing Data for Hepatocellular Carcinoma: A Novel Glycosylation (GLY)/Tumor Microenvironment (TME) Classifier to Predict Prognosis and Immunotherapy Response

Yun Wu et al. Metabolites. .

Abstract

The major liver cancer subtype is hepatocellular carcinoma (HCC). Studies have indicated that a better prognosis is related to the presence of tumor-infiltrating lymphocytes (TILs) in HCC. However, the molecular pathways that drive immune cell variation in the tumor microenvironment (TME) remain poorly understood. Glycosylation (GLY)-related genes have a vital function in the pathogenesis of numerous tumors, including HCC. This study aimed to develop a GLY/TME classifier based on glycosylation-related gene scores and tumor microenvironment scores to provide a novel prognostic model to improve the prediction of clinical outcomes. The reliability of the signatures was assessed using receiver operating characteristic (ROC) and survival analyses and was verified with external datasets. Furthermore, the correlation between glycosylation-related genes and other cells in the immune environment, the immune signature of the GLY/TME classifier, and the efficacy of immunotherapy were also investigated. The GLY score low/TME score high subgroup showed a favorable prognosis and therapeutic response based on significant differences in immune-related molecules and cancer cell signaling mechanisms. We evaluated the prognostic role of the GLY/TME classifier that demonstrated overall prognostic significance for prognosis and therapeutic response before treatment, which may provide new options for creating the best possible therapeutic approaches for patients.

Keywords: glycosylation modification; hepatocellular carcinoma; malignant epithelial cells; prognosis; single-cell sequencing; tumor immune microenvironment.


Conflict of interest statement

The authors declare no conflicts of interest.

Figures

Figure 1
Figure 1
The GLY score and the TME score were developed in the training cohort based on glycosylation-related genes and tumor immune microenvironment cells. (A) Left panel: tenfold cross-validation of variable selection in LASSO regression using the minimum criteria. Right panel: LASSO coefficients for glycosylation. Each curve represents one glycosylation-related gene. (B) Forest plot showing gene expression and the OS outcomes. (C) The lollipop plot represents the logFC values of 15 glycosylation-related prognostic genes. A logFC > 0 indicates upregulated genes; logFC < 0 indicates downregulated genes. The colors represent the different significance levels of the gene, where orange represents p value < 0.001, blue represents p value < 0.01, and green represents p value < 0.05. (DF) KM curves indicate that patients with high infiltration of activated NK cells, M1 macrophages, and CD8 T cells have a better prognosis. (G) Forest plot revealing the predictive value of three immune cells correlated with a good prognosis in HCC (HR < 1). (* p < 0.05, ** p < 0.01).
Figure 2
Figure 2
The relative expression level of glycosylation-related prognostic genes. (A) The relative mRNA level of PPIA, ALG3, CTSA, CAD, B3GAT3, TRAPPC3, HSP90AA1, SRD5A3, BAG2, DNAJC1, ADAMTS5, PLOD2, DYNC1LI1, ST6GALNAC4, and CHP1. (B) Expression of 15 hub genes in HCC primary tumor samples and adjacent normal tissues at the protein level from the CPTAC database (n = 165). (C) Expression of 15 hub genes in MIHA cell and HCC-LM3 cell at the protein level. (Data are presented as the mean ± SD, ** p < 0.01, *** p < 0.001, **** p < 0.0001, and ns, no significance.).
Figure 3
Figure 3
Evaluation of the prognostic power of GLY score and TME score. (A) KM survival analysis of the GLY score groups. The yellow and blue lines represent the high and low GLY scores, respectively. (B) The KM survival curve shows that patients with a low TME score in the training dataset had significantly shorter OS than those with a high TME score (p < 0.001). (C) GSEA demonstrated that the hallmark significantly enriched pathways. The high GLY score is located on the left of the origin of the x-axis, and the low GLY score is located on the right of the x-axis. (D) The hallmark pathways were significantly enriched in both the low- and high-TME score groups. The high TME score is to the left of the origin of the x-axis, whereas the low TME score is to the right. (E) The t-SNE plot of all 18,985 cells collected from 2 individuals with primary liver cancer. Each color represents one cell type. (F) t-SNE plots colored according to GLY score. (G) Differential expression of 15 glycosylation-related prognostic genes in all cell types.
Figure 4
Figure 4
Construction and evaluation of the GLY/TME classifier. (A) Heatmap showing the correlations between 15 glycosylation-related prognostic genes and three prognostic-related immune cells. (B) Utilizing KM curves and the log-rank test, the prognoses of patients in the four subgroups were compared (GLYlow/TMEhigh, GLYlow/TMElow, GLYhigh/TMEhigh, and GLYhigh/TMElow). (C) The AUCs of ROC curves according to the GLY/TME classifier for predicting survival of HCC patients in the training cohort. (D) KM survival curves in the training cohort according to the GLY/TME classifier divided into three different subgroups (GLYlow/TMEhigh, mixed, and GLYhigh/TMElow). Log-rank test, p < 0.001. (E) Multivariate Cox regression analysis of the GLY/TME classifier in the training cohort. (*** p < 0.001).
Figure 5
Figure 5
Identification of signature genes and particular biological mechanisms. (A) WGCNA was used to analyze the network topology for various soft-threshold powers. The right panel shows the effect of soft-threshold power on average connectivity, while the left panel shows the effect of soft-threshold power on the scale-free topology fit index. (B) Dendrogram (cluster tree) according to different metrics. (C) Heatmap of correlations between module signature genes and molecular phenotypes. (D) Pathway enrichment analysis of module genes in the GLYHigh/TMElow subgroup. (E) FGSEA showed the enriched BP pathways in the GLYhigh/TMElow subgroup, GLYlow/TMEhigh subgroup, and mixed subgroup. (F) TIP database was used to visualize the variation in immune pathways across the three subgroups.
Figure 6
Figure 6
Differences in cell-to-cell communication between malignant cells with different GLY scores and cells within the TME. (A) Number and strength of cell-to-cell interactions. (B) LR pairs from immune cells and stromal cells to malignant cells. (C) LR pairs from malignant cells to immune cells and stromal cells. (D) SPP1 signaling pathways between GLYhigh malignant cells and immune cells and stromal cells in HCC.
Figure 7
Figure 7
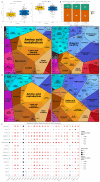
Prediction of treatment response based on the GLY/TME classifier. (A) The left panel represents the comparison of glycosylation-related gene scores. The right panel indicates the comparison of tumor microenvironment scores (true, responders; false, non-responders). (B) Different percentages of immunotherapy responders in subgroups based on the GLY/TME classifier (true, responders; false, non-responders). (C) Functional analysis of GLYlow/TMEhigh patients receiving immunotherapy. The left is based on upregulated genes, and the right is based on downregulated genes. The size of each small polygon, representing a KEGG pathway, is correlated with the proportion of subgroups. (D) Functional analysis of patients responding to immunotherapy. The left is based on upregulated genes, and the right is based on downregulated genes. The size of each small polygon, representing a KEGG pathway, is correlated with the proportion of subgroups. (E) Correlation analysis between model gene and immune checkpoint.
Figure 8
Figure 8
Drug sensitivity analysis of GLYlow/TMEhigh patients versus GLYhigh/TMElow patients. (AH) Response of the two subgroups to chemotherapeutic drugs. p values are shown with asterisks in the figure.

Similar articles

Cited by

References

    1. Llovet J.M., Kelley R.K., Villanueva A., Singal A.G., Pikarsky E., Roayaie S., Lencioni R., Koike K., Zucman-Rossi J., Finn R.S. Hepatocellular carcinoma. Nat. Rev. Dis. Primers. 2021;7:6. doi: 10.1038/s41572-020-00240-3. - DOI - PubMed
    1. Anwanwan D., Singh S.K., Singh S., Saikam V., Singh R. Challenges in liver cancer and possible treatment approaches. Biochim. Biophys. Acta Rev. Cancer. 2020;1873:188314. doi: 10.1016/j.bbcan.2019.188314. - DOI - PMC - PubMed
    1. Ikeda M., Morizane C., Ueno M., Okusaka T., Ishii H., Furuse J. Chemotherapy for hepatocellular carcinoma: Current status and future perspectives. Jpn. J. Clin. Oncol. 2018;48:103–114. doi: 10.1093/jjco/hyx180. - DOI - PubMed
    1. Kim E., Viatour P. Hepatocellular carcinoma: Old friends and new tricks. Exp. Mol. Med. 2020;52:1898–1907. doi: 10.1038/s12276-020-00527-1. - DOI - PMC - PubMed
    1. Shokoohian B., Negahdari B., Aboulkheyr Es H., Abedi-Valugerdi M., Baghaei K., Agarwal T., Maiti T.K., Hassan M., Najimi M., Vosough M. Advanced therapeutic modalities in hepatocellular carcinoma: Novel insights. J. Cell. Mol. Med. 2021;25:8602–8614. doi: 10.1111/jcmm.16875. - DOI - PMC - PubMed

LinkOut - more resources