

Thyroid Hormone Metabolites Quantified in Pup and Adult Rat Cerebellum, Cortex and Whole-Brain Samples Using an Automated Online SPE-LC-MS/MS Method
- PMID: 38248864
- PMCID: PMC10820277
- DOI: 10.3390/metabo14010061
Thyroid Hormone Metabolites Quantified in Pup and Adult Rat Cerebellum, Cortex and Whole-Brain Samples Using an Automated Online SPE-LC-MS/MS Method
Abstract
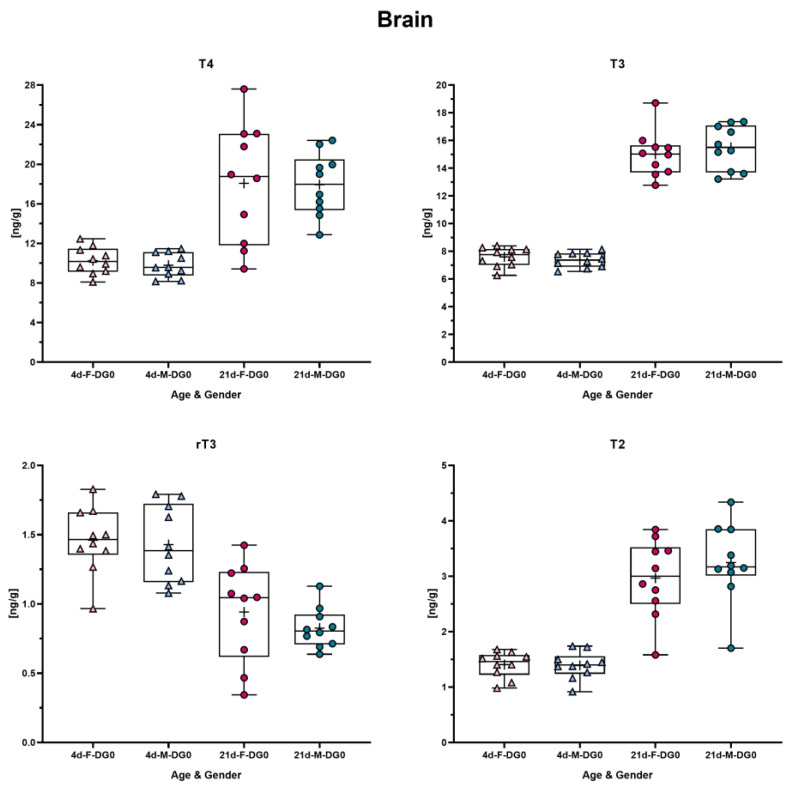
Changes in thyroid hormone (TH) levels in rat brain at early developmental stages are correlated with adverse effects on offspring development. To characterize the ability of substances to interfere with the TH concentrations in, e.g., rat brain, it is essential to know the mean TH concentrations in this tissue under control conditions. In this publication, an online solid-phase extraction (SPE) liquid chromatography (LC) tandem mass spectrometry (MS/MS) method was validated and used to measure TH metabolites (T4, T3, rT3, T2 and T1) in the brains of untreated rats. Data on TH concentrations in the whole brain and separate data from the cerebellum and the cortex are shown. The corresponding samples were gathered from young rats at postnatal days (PND) 4 and 21/22 and from adult rats. The results show inter alia the high accuracy and precision of the method, and LOQs of 0.02 ng/mL were determined for T1, T2 and rT3 and of 0.15 ng/mL for T3 and T4. Technical variability is low, as shown by the relative standard deviations of 7.5-20%. For our rat model, we found that T4, T3 and T2 concentrations rise from PND4 to PND21, whereas the rT3 concentration decreases; as well as there is no statistical difference between TH concentrations in the male and female rat brain. This method is suitable to analyze TH metabolites in the brain and build up a database of historical TH concentrations in control rats. Together, this yields a robust diagnostic tool to detect potentially adverse disturbances of TH homeostasis in the most vulnerable anatomic structure.
Keywords: LC-MS/MS; automated SPE; brain; cerebellum; cortex; rat; thyroid hormones.
Conflict of interest statement
All authors are employees at the company BASF and might use this method in product development. Otherwise, no conflicts of interest are declared.
Figures


Similar articles
-
A Novel and Fast Online-SPE-LC-MS/MS Method to Quantify Thyroid Hormone Metabolites in Rat Plasma.Chem Res Toxicol. 2024 Jan 15;37(1):33-41. doi: 10.1021/acs.chemrestox.3c00152. Epub 2023 Dec 11. Chem Res Toxicol. 2024. PMID: 38078760
-
Rapid determination of thyroid hormones in blood plasma from Glaucous gulls and Baikal seals by HybridSPE®-LC-MS/MS.J Chromatogr B Analyt Technol Biomed Life Sci. 2021 Jan 1;1162:122447. doi: 10.1016/j.jchromb.2020.122447. Epub 2020 Nov 17. J Chromatogr B Analyt Technol Biomed Life Sci. 2021. PMID: 33285510
-
LC-MS/MS detection of thyroid hormone metabolites in tissue samples.Expert Rev Endocrinol Metab. 2012 Sep;7(5):511-513. doi: 10.1586/eem.12.48. Expert Rev Endocrinol Metab. 2012. PMID: 30780887
-
Recent advances in liquid chromatography-tandem mass spectrometry for the detection of thyroid hormones and thyroglobulin in clinical samples: A review.J Sep Sci. 2024 Sep;47(18):e2400466. doi: 10.1002/jssc.202400466. J Sep Sci. 2024. PMID: 39294846 Review.
-
Androgen glucuronides analysis by liquid chromatography tandem-mass spectrometry: could it raise new perspectives in the diagnostic field of hormone-dependent malignancies?J Chromatogr B Analyt Technol Biomed Life Sci. 2013 Dec 1;940:24-34. doi: 10.1016/j.jchromb.2013.09.022. Epub 2013 Sep 27. J Chromatogr B Analyt Technol Biomed Life Sci. 2013. PMID: 24140653 Review.
Cited by
-
A proposal of criteria to support the EU classification on endocrine disruption for the thyroid modality and their application to four data-rich case studies.Arch Toxicol. 2025 Jul;99(7):2727-2758. doi: 10.1007/s00204-025-04037-9. Epub 2025 May 10. Arch Toxicol. 2025. PMID: 40347277 Free PMC article.
References
-
- Korevaar T.I., Muetzel R., Medici M., Chaker L., Jaddoe V.W., de Rijke Y.B., Steegers E.A., Visser T.J., White T., Tiemeier H., et al. Association of maternal thyroid function during early pregnancy with offspring IQ and brain morphology in childhood: A population-based prospective cohort study. Lancet Diabetes Endocrinol. 2016;4:35–43. doi: 10.1016/S2213-8587(15)00327-7. - DOI - PubMed
-
- Noyes P.D., Friedman K.P., Browne P., Haselman J.T., Gilbert M.E., Hornung M.W., Barone S., Jr., Crofton K.M., Laws S.C., Stoker T.E., et al. Evaluating Chemicals for Thyroid Disruption: Opportunities and Challenges with In Vitro Testing and Adverse Outcome Pathway Approaches. Environ. Health Perspect. 2019;127:95001. doi: 10.1289/EHP5297. - DOI - PMC - PubMed
LinkOut - more resources
Full Text Sources
