Review
. 2024 Jan 12;11(1):22.
doi: 10.3390/jcdd11010022.

Cardiovascular Computed Tomography in the Diagnosis of Cardiovascular Disease: Beyond Lumen Assessment

Affiliations
Review

Cardiovascular Computed Tomography in the Diagnosis of Cardiovascular Disease: Beyond Lumen Assessment

Zhonghua Sun et al. J Cardiovasc Dev Dis. .

Abstract

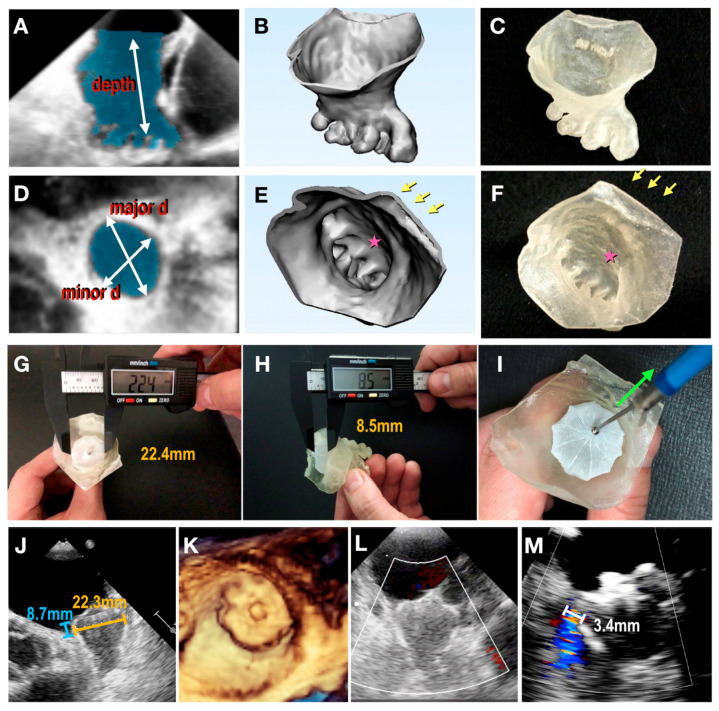
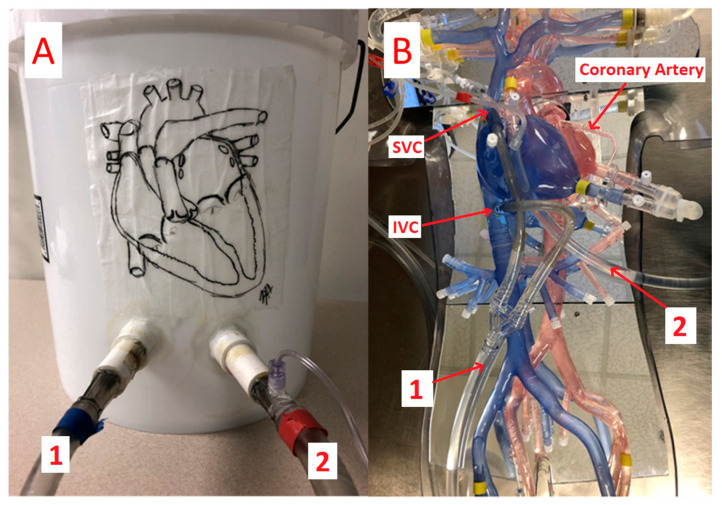
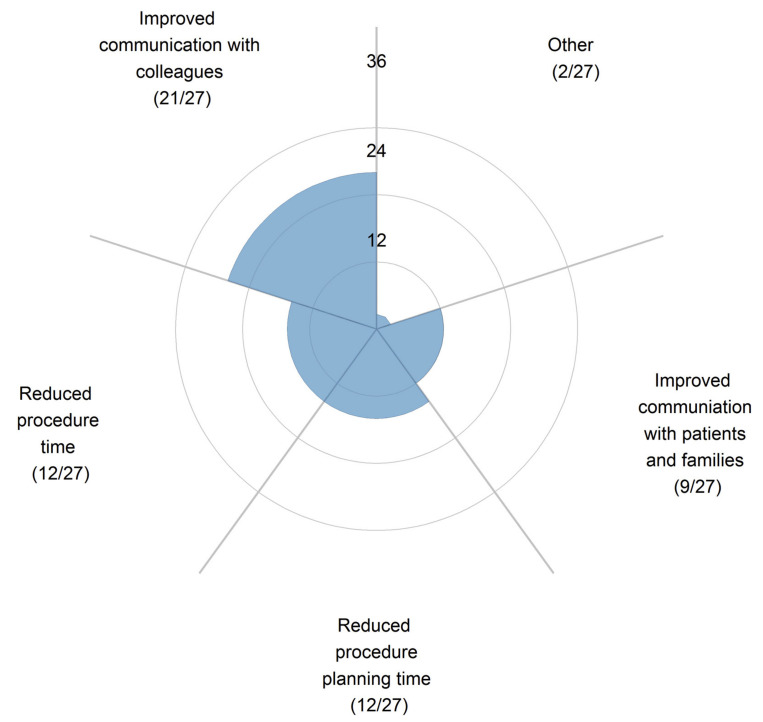
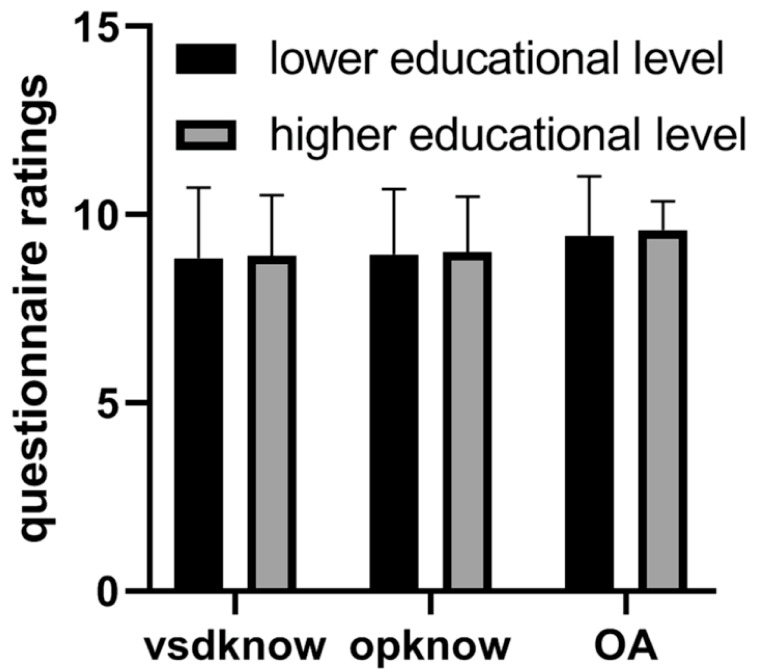
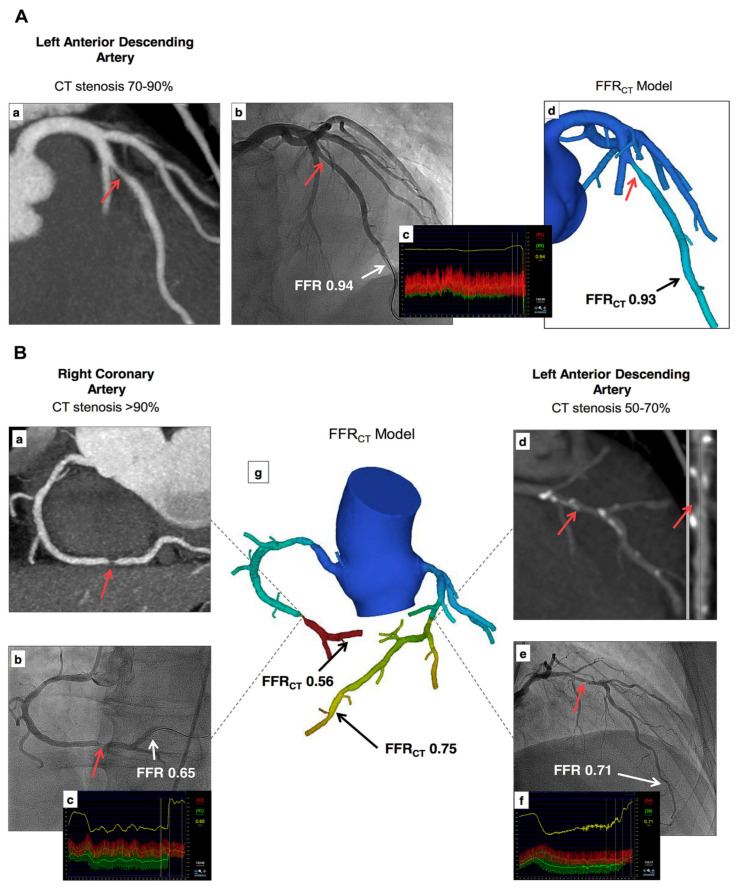
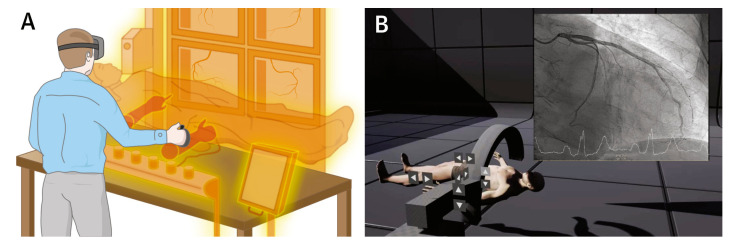
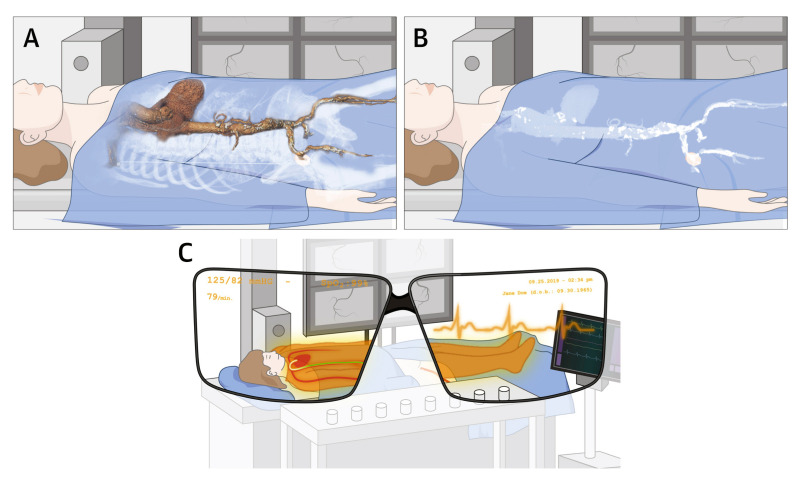
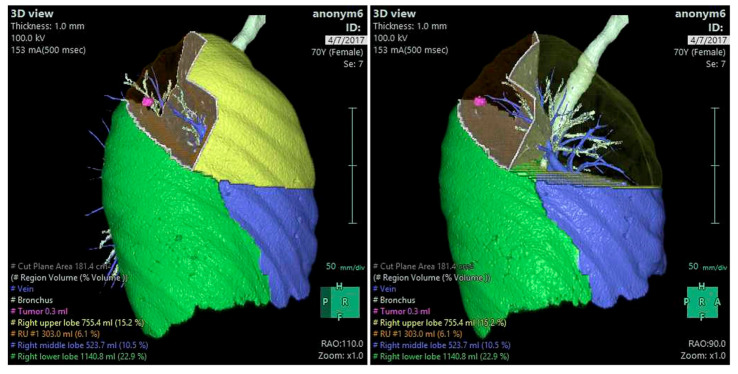
Cardiovascular CT is being widely used in the diagnosis of cardiovascular disease due to the rapid technological advancements in CT scanning techniques. These advancements include the development of multi-slice CT, from early generation to the latest models, which has the capability of acquiring images with high spatial and temporal resolution. The recent emergence of photon-counting CT has further enhanced CT performance in clinical applications, providing improved spatial and contrast resolution. CT-derived fractional flow reserve is superior to standard CT-based anatomical assessment for the detection of lesion-specific myocardial ischemia. CT-derived 3D-printed patient-specific models are also superior to standard CT, offering advantages in terms of educational value, surgical planning, and the simulation of cardiovascular disease treatment, as well as enhancing doctor-patient communication. Three-dimensional visualization tools including virtual reality, augmented reality, and mixed reality are further advancing the clinical value of cardiovascular CT in cardiovascular disease. With the widespread use of artificial intelligence, machine learning, and deep learning in cardiovascular disease, the diagnostic performance of cardiovascular CT has significantly improved, with promising results being presented in terms of both disease diagnosis and prediction. This review article provides an overview of the applications of cardiovascular CT, covering its performance from the perspective of its diagnostic value based on traditional lumen assessment to the identification of vulnerable lesions for the prediction of disease outcomes with the use of these advanced technologies. The limitations and future prospects of these technologies are also discussed.

Keywords: 3D; 3D printing; artificial intelligence; cardiac computed tomography; coronary artery disease; diagnosis; mixed reality; virtual reality; visualization.


Conflict of interest statement

The authors declare no conflicts of interest.

Figures

Figure 1
Figure 1
Imaging principle differences between standard energy-integrating detectors (EIDs) and photon-counting detectors (PCDs). X-ray photons are directly converted into electrical signals by a semiconductor on the PCD (right image); in contrast, X-ray photons are absorbed by the scintillator and converted into visible light, which is then collected by the light sensor that generates an electrical signal (left image). The long blue arrows indicate the difference of converting X-ray photons into electric signals between PCCT and EID CT. Reprinted with permission under open access from Tortora et al. [21].
Figure 2
Figure 2
An 82-year-old man with coronary artery disease. The visualization of calcified plaques and the lumen diameter of the proximal left anterior descending coronary artery was improved via the acquisition of high-resolution photon-counting CT images (b) with 0.2 mm slice thickness rather than images obtained using standard CT (a) with 0.6 mm slice thickness. Arrow refers to larger perfused diameter of the proximal left anterior descending coronary artery in PCCT (b) than that observed with standard CT (a) which shows nearly occluded coronary lumen. Reprinted with permission under open access from Flohr et al. [24].
Figure 3
Figure 3
Cardiac PCCT visualization of coronary stents and stented lumen. There are two stents at the level of the proximal and middle RCA (A) and one stent on the marginal branch of the left LCx (C); the LAD (B) is normal, without any detectable atherosclerotic disease. All stents are perfectly visualized in terms of their inner struts and also in their inner lumen, which is difficult to achieve using standard cardiac CT. PCCT—photon-counting CT, LAD—left anterior descending, LCx—left circumflex, RCA—right coronary artery. Reprinted with permission under open access from Cademartiri et al. [22].
Figure 4
Figure 4
Cardiac PCCT: example of a follow-up of an aortic valve prosthesis that shows significant signs of Hypo-Attenuating Leaflet Thickening (HALT) due to thrombotic apposition (arrowheads). A very thin layer of hypodense tissue can be easily seen in the high-resolution PCCT image. Reprinted with permission under open access from Cademartiri et al. [22].
Figure 5
Figure 5
Learning materials provided to the study groups: Phase 1 materials include plastinated cardiac specimens (top row) and their three-dimensionally printed replicas and the coronary vessels (bottom row). Reprinted with permission from Mogali et al. [102].
Figure 6
Figure 6
A 3D-printed model of the tricuspid valve of a human heart specimen (HH 223). (A) A model printed using a clear material as viewed from the atrium, with leaflets labeled and the moderator band marked with a red arrow. (B) A model printed using multiple colors and materials and rotated to show the subvalvular apparatus. Yellow, tricuspid annulus; transparent, mitral leaflets; blue, chordae tendinea; pink, papillary muscles. Reprinted with permission from Arango et al. [103].
Figure 7
Figure 7
High-resolution fusion powder 3D-printed heart models representing the transesophageal echocardiography (TEE) American Society of Echocardiography (ASE)-recommended views. Each row represents two corresponding planes on each model that have been labeled accordingly. LAX, long axis; RV, right ventricle; SAX, short axis; TG, transgastric. Reprinted with permission from Arango et al. [103].
Figure 8
Figure 8
Surgical and interventional planning on 3D-printed heart models. DORV case, internal vision from the left ventricle (left). DORV (another case), external view (right). DORV-double outlet right ventricle. Reprinted with permission under the open access from Gomez-Ciriza et al. [59].
Figure 9
Figure 9
Stent graft deployed in a 3D-printed model. (A) Deployed stent graft visible through model wall. (B) Axial view from proximal arch. (C) Caudal view down arch vessels. Reprinted with permission under open access from Wu et al. [113].
Figure 10
Figure 10
Three-dimensionally printed models with an a pulsatile circulation simulator for the assessment of transcatheter valve hemodynamics. (A) Aortic root with left ventricular outflow tract. (B) Three-dimensionally printed models of the thoracic aorta, abdominal aorta, and iliofemoral arteries. (C) Pulsatile circulation system. (D) Representative hemodynamic waveforms of left ventricular pressure (red line), aortic pressure (blue line), flow rate (green line), and the definition of closing volume and PVL (red and yellow areas). PVL = paravalvular leakage. Reprinted with permission from Tanaka et al. [115].
Figure 10
Figure 10
Three-dimensionally printed models with an a pulsatile circulation simulator for the assessment of transcatheter valve hemodynamics. (A) Aortic root with left ventricular outflow tract. (B) Three-dimensionally printed models of the thoracic aorta, abdominal aorta, and iliofemoral arteries. (C) Pulsatile circulation system. (D) Representative hemodynamic waveforms of left ventricular pressure (red line), aortic pressure (blue line), flow rate (green line), and the definition of closing volume and PVL (red and yellow areas). PVL = paravalvular leakage. Reprinted with permission from Tanaka et al. [115].
Figure 11
Figure 11
Fluoroscopic documentation of the balloon dilatation of valvular stenoses with a 3D-printed heart model. (A) Balloon dilatation of a valvular aortic stenosis. (B) Balloon dilatation of a valvular pulmonary stenosis. AS—aortic stenosis, PS—pulmonary stenosis, LA—left atrium, LV—left ventricle, RA—right atrium, RV—right ventricle. Reprinted with permission under the open access from Brunner et al. [116].
Figure 12
Figure 12
Three-dimensionally printed patient-specific models based on echocardiographic images. (AF) From 3D transesophageal echocardiography (TEE) image to 3D physical model. (A,D) Segmentation of left atrial appendage (LAA) (shaded area) based on 3D TEE data. Measurements regarding the major and minor ostial diameters and depth of the LAA were taken. (B,E) Creation of a digital object. (C,F) Three-dimensional printed physical model made of tissue-mimicking material. Arrows denote pulmonary vein ridge; stars denote appendicular trabeculations. (GI) Modifying the size of the 3D model. (G) Device compression and (H) protrusion in 3D model measured using a digital caliper. (I) Tug test for stability. (J) Device compression and protrusion measured in a clinical procedure. (K) Three-dimensional TEE en face view of final device position. (L) Color Doppler assessment showing no peridevice leaks. (M) In another case, color Doppler assessment revealed a residual leak with a jet width of 3.4 mm. Reprinted with permission under open access from Fan et al. [112].
Figure 13
Figure 13
A traditional bucket patient simulator (A) and a 3D-printed anatomic patient simulator (B). 1 indicates the venous line; 2 indicates the arterial line. IVC, inferior vena cava; SVC, superior vena cava. The red arrows indicate the direction of flow. Reprinted with permission under open access from Messarra et al. [120].
Figure 14
Figure 14
Participants’ responses on how 3D-printed cardiac models improve communication with colleagues and patients/families. Reprinted with permission under open access from Illmann et al. [122].
Figure 15
Figure 15
Comparison of questionnaire results regarding different education levels (which did not show significant differences). vsdknow: VSD knowledge, opknow: operation knowledge, OA: overall understanding. Reprinted with permission under open access from Deng et al. [128].
Figure 16
Figure 16
Comparison of questionnaire responses between the two groups in the aforementioned study conducted by Deng et al. Guardians’ understanding of both VSD and operation knowledge was found to be significantly higher in the 3D printing group, although no significant differences were found in the overall ratings. vsdknow: VSD knowledge, opknow: Operation knowledge, OA: overall understanding. Reprinted with permission under open access from Deng et al. [128].
Figure 17
Figure 17
The resulting axial CT of (A) four inserts in Catphan@ 500 phantom; (B,C) patient image datasets for cardiac CT; (D) original cardiac insert of anthropomorphic chest phantom; (E,F) 3D-printed cardiac insert phantom with the contrast materials (CM), oil, air, water, and jelly segmented all labeled. Reprinted with permission under the open access from Abdullah et al. [139].
Figure 18
Figure 18
Three-dimensional printed patient-specific coronary models based on the simulation of calcified plaques in the coronary arteries. (A) Three-dimensional printed models (n = 6) with simulated calcified plaques in coronary artery branches. (B) Measurements of plaque dimensions on 2D maximum-intensity projection images using 0.5 mm slice thickness. Reprinted with permission under open access from Sun et al. [130].
Figure 19
Figure 19
Sagittal reformatted images of CTA protocols. When kVp was decreased to 80, image noise increased with the use of high-pitch protocol values of 2.0 and 2.5. CTA: computed tomography angiography; kVp: kilovoltage peak. Reprinted with permission under open access from Wu et al. [113].
Figure 20
Figure 20
Diagram highlighting 3D bioprinting applications. Reprinted with permission under open access from Häneke et al. [158]. CM—cardiomyocyte; HCM—hypertrophic cardiomyopathy; hiPSC—human inducible pluripotent stem cell.
Figure 21
Figure 21
Steps involved in creating 3D-printed models using cardiac CT and MR data. CTA—computed tomography angiography; CMR—cardiac magnetic resonance. Reprinted with permission under open access from Sun et al. [52].
Figure 22
Figure 22
Commonly used 3D printers. Reprinted with permission under open access from Gharleghi et al. [162].
Figure 23
Figure 23
Three-dimensional printing technologies and materials. FDM—fused deposition modeling, SLA—stereolithography, DLP—digital light processing, ABS—acrylonitrile–butadiene–styrene, PLA—polylactic acid, TPU—thermoplastic polyurethane, TPE—thermoplastic elastomers, HIPS—high-impact polystyrene, PVA—polyvinyl alcohol, CJP—color jet printing, SLS—selective laser sintering, SLM—selective laser melting, CoCr—cobalt–chromium, Ni—nickel, Ti—titanium. Reprinted with permission under open access from Gharleghi et al. [162].
Figure 24
Figure 24
Examples of FFRCT in assessing the hemodynamic significance of coronary lesions at three main coronary arteries (A,B). Coronary CT angiography shows significant stenoses on the left anterior descending artery (LAD), right coronary artery (RCA), and left circumflex (LCx), while FFRCT shows ischemia at RCA and LCx but not at LAD, as the FFRCT value is more than 0.80. This was confirmed by invasive FFR measurements, as shown in (A(c)) and (B(c,f)). (a,b) in image (A), (a,b,d,e) in image (B) refer to stenotic lesions of RCA and LAD on coronary CT angiography and invasive FFR measurements, respectively, while ((A)d,(B)g) indicate FFRCT measurements at these coronary arteries. Reprinted with permission from Norgaard et al. [43].
Figure 25
Figure 25
VR completely immersing the user in a virtual 3D space. (A) User is completely immersed in a virtual 3D space with use of a head-mounted display. (B) A real-life example of VR application allowing trainees to perform virtual coronary angiograms. Reprinted with permission from Jun et al. [173].
Figure 26
Figure 26
AR integrates superimposed virtual elements into a real-world environment. (A) 3D CT image of a patient’s vasculature could be imaged by an operator or (B) vascular calcifications could be focused to guide the best puncture site and avoid complications during the procedure. (C) AR superimposes virtual elements into a real-world environment. Reprinted with permission from Jun et al. [173].
Figure 27
Figure 27
Virtual simulation of segmentectomy. Reprinted with permission under open access from Rd et al. [186].
Figure 28
Figure 28
Multiple calcified plaques at the left anterior descending artery (LAD) in a 72-year-old female. Coronary stenoses were measured at 80%, 78%, 72%, and 70% corresponding to the original CCTA, Real-ESRGAN-HR, Real-ESRGAN-Average and Real-ESRGAN-Median images (short arrows in (A)), respectively. ICA (short arrow in (B)) confirms 75% stenosis. The distal stenoses at LAD due to calcified plaques were measured at 70%, 50%, and 51% stenosis on original CCTA, Real-ESRGAN-HR, and Real-ESRGAN-Average images but measured at 45% on Real-ESRGAN-Median images (long arrows in (A)). ICA confirmed the only 37% stenosis (long arrow in (B)). CCTA—coronary computed tomography angiography; ESRGAN—enhanced super-resolution generative adversarial network; HR—high resolution; ICA—invasive coronary angiography, Real-ESRGAN—real-enhanced super-resolution generative adversarial network. Reprinted with permission under open access from Sun and Ng [89].
Figure 28
Figure 28
Multiple calcified plaques at the left anterior descending artery (LAD) in a 72-year-old female. Coronary stenoses were measured at 80%, 78%, 72%, and 70% corresponding to the original CCTA, Real-ESRGAN-HR, Real-ESRGAN-Average and Real-ESRGAN-Median images (short arrows in (A)), respectively. ICA (short arrow in (B)) confirms 75% stenosis. The distal stenoses at LAD due to calcified plaques were measured at 70%, 50%, and 51% stenosis on original CCTA, Real-ESRGAN-HR, and Real-ESRGAN-Average images but measured at 45% on Real-ESRGAN-Median images (long arrows in (A)). ICA confirmed the only 37% stenosis (long arrow in (B)). CCTA—coronary computed tomography angiography; ESRGAN—enhanced super-resolution generative adversarial network; HR—high resolution; ICA—invasive coronary angiography, Real-ESRGAN—real-enhanced super-resolution generative adversarial network. Reprinted with permission under open access from Sun and Ng [89].
Figure 29
Figure 29
The use of deep learning for plaque segmentation. (A) Curved multi-planar reformation coronary CTA images showing lesions in the proximal-to-mid LAD (1) and the mid LAD (2). (B) Deep learning segmentation of calcified plaque (yellow) and non-calcified plaque (red). (C) Three-dimensionally rendered view of the coronary tree showing deep learning plaque segmentation in the individual analyzed segments. All lesions in each vessel were analyzed by deep learning and measurements summed on a per-patient level. CTA—computed tomography angiography; LAD—left anterior descending artery. Reprinted with permission under open access from Lin et al. [194].
Figure 30
Figure 30
Representative images of the segmentation of the aortic lumen (in red) and the intraluminal thrombus (in green). (A) CT scan cross-sectional views of patients with infrarenal AAA. (B) Manual segmentation. (C) Automatic segmentation. Reprinted with permission under open access from Lareyre et al. [201].
Figure 31
Figure 31
Interpretation with Grad-CAM and attention weights. True-positive (ad) and false-negative (e,f) samples of Grad-CAM and original image for positional labels. For each sample, the processed CT image (right) and the corresponding attention-mapped image are paired (left). The red arrow points to the precise location of the PE identified by an experienced radiologist. The heatmap below shows the attention weights of all windows in the study containing the image above, while the orange square marks the exact window that includes the image. Darker colors in the heatmap illustrate larger attention weights. Reprinted with permission under open access from Ma et al. [211].
Figure 32
Figure 32
The performance of the proposed network framework. (a,d) The original images of the heart and pulmonary artery, respectively; (b,e) the segmentation outputs of nnU-Net; (c,f) the segmentation outputs of the proposed network framework. Segmented structures include right atrium (yellow), right ventricle (green), left atrium (blue), left ventricle (red), main pulmonary artery (red), right pulmonary artery (green) and left pulmonary artery (blue). Reprinted with permission under open access from Zhang et al. [214].
Figure 33
Figure 33
Bland–Altman analyses for features assessed by AI automatic and manual measurements show that the metrics measured by the automatic measurement method are in accordance with the ground-truth measured manually by experienced physicians. Reprinted with permission under open access from Zhang et al. [214].
Figure 34
Figure 34
Three-dimensionally printed heart model of a patient with Tetralogy of Fallot. This model was printed based on cardiac CT images using Agilus30 material, and its tissue properties are similar to those of human heart tissues. The model was printed in one piece (A) and a two halves (B) to show the internal structures. The arrows refer to the pulmonary artery stenoses. AO—aorta, PA—pulmonary artery, RV—right ventricle. Reprinted with permission under open access from Sun [215].
Figure 34
Figure 34
Three-dimensionally printed heart model of a patient with Tetralogy of Fallot. This model was printed based on cardiac CT images using Agilus30 material, and its tissue properties are similar to those of human heart tissues. The model was printed in one piece (A) and a two halves (B) to show the internal structures. The arrows refer to the pulmonary artery stenoses. AO—aorta, PA—pulmonary artery, RV—right ventricle. Reprinted with permission under open access from Sun [215].
Figure 35
Figure 35
The applications of artificial intelligence in clinical cardiology practice. CAC—coronary calcium score, CAD—coronary artery disease, EAT—epicardial adipose tissue, PVAT—perivascular adipose tissue, LV—left ventricle. Reprinted with permission under open access from Jiang et al. [216].

Similar articles

Cited by

References

    1. Gulsin G.S., McVeigh N., Leipsic J.A., Dodd J.D. Cardiovascular CT and MRI in 2020: Review of key articles. Radiology. 2021;301:263–277. doi: 10.1148/radiol.2021211002. - DOI - PubMed
    1. Sayed A., Munir M., Bahbah E.I. Aortic Dissection: A Review of the Pathophysiology, Management and Prospective Advances. Curr. Cardiol. Rev. 2021;17:e230421186875. doi: 10.2174/1573403X16666201014142930. - DOI - PMC - PubMed
    1. Abbas A., Brown I., Peebles C., Harden S., Shambrook J. The role of multidetector-row CT in the diagnosis, classification and management of acute aortic syndrome. Br. J. Radiol. 2014;87:20140354. doi: 10.1259/bjr.20140354. - DOI - PMC - PubMed
    1. Seitun S., Clemente A., Maffei E., Toia P., La Grutta L., Cademartiri F. Prognostic value of cardiac CT. Radiol. Medica. 2020;125:1135–1147. doi: 10.1007/s11547-020-01285-w. - DOI - PubMed
    1. Sun Z. Cardiac CT imaging in coronary artery disease: Current status and future directions. Quant. Imaging Med. Surg. 2012;2:98–105. doi: 10.3978/j.issn.2223-4292.2012.05.02. - DOI - PMC - PubMed

LinkOut - more resources