

The Protein Response of Salt-Tolerant Zygosaccharomyces rouxii to High-Temperature Stress during the Lag Phase
- PMID: 38248957
- PMCID: PMC10817685
- DOI: 10.3390/jof10010048
The Protein Response of Salt-Tolerant Zygosaccharomyces rouxii to High-Temperature Stress during the Lag Phase
Abstract
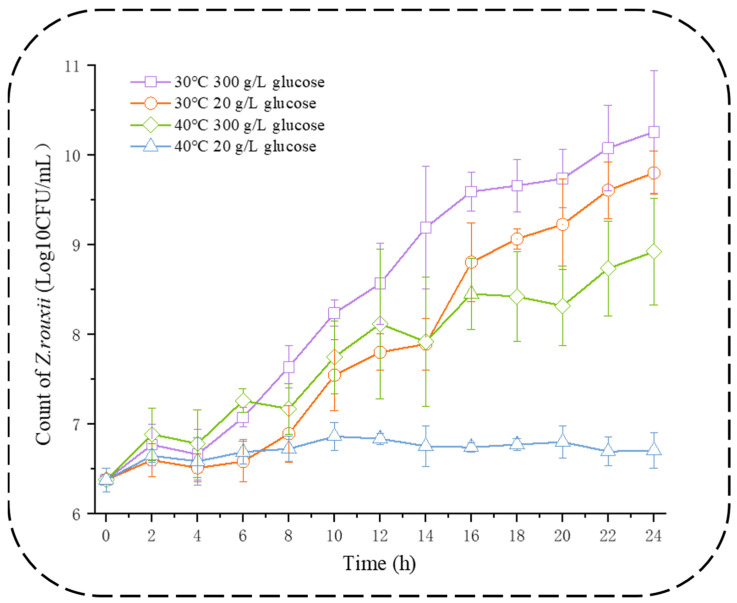
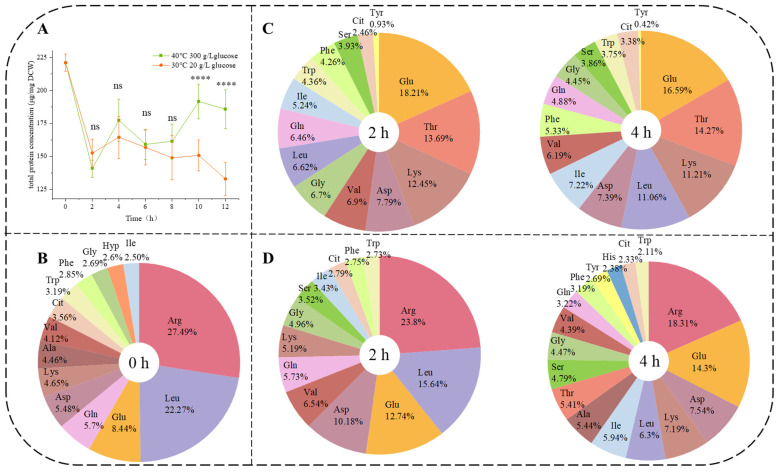
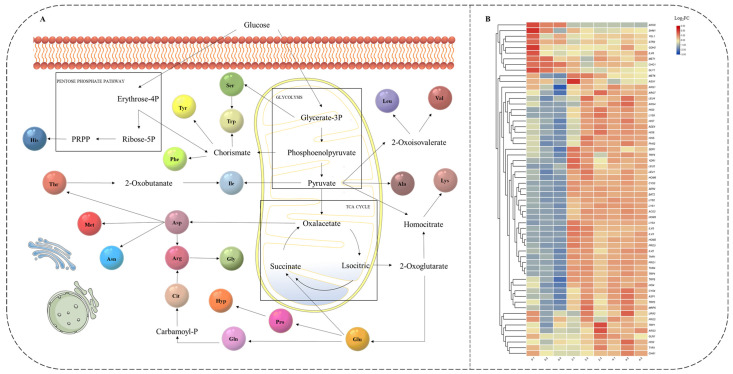
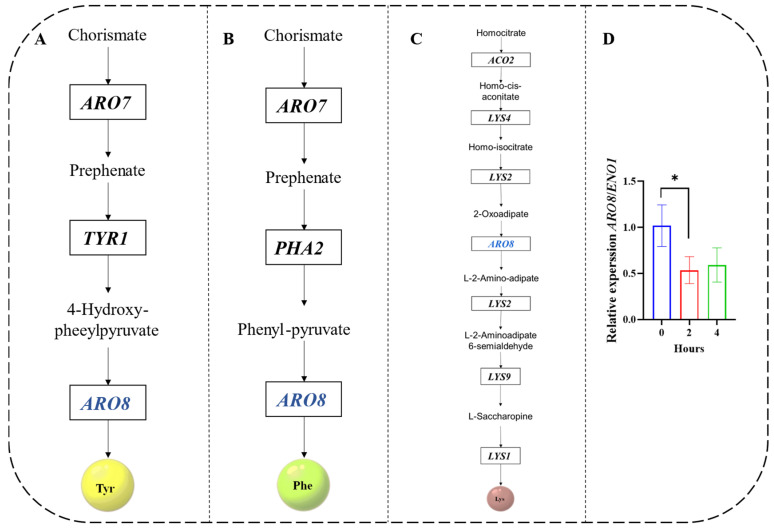
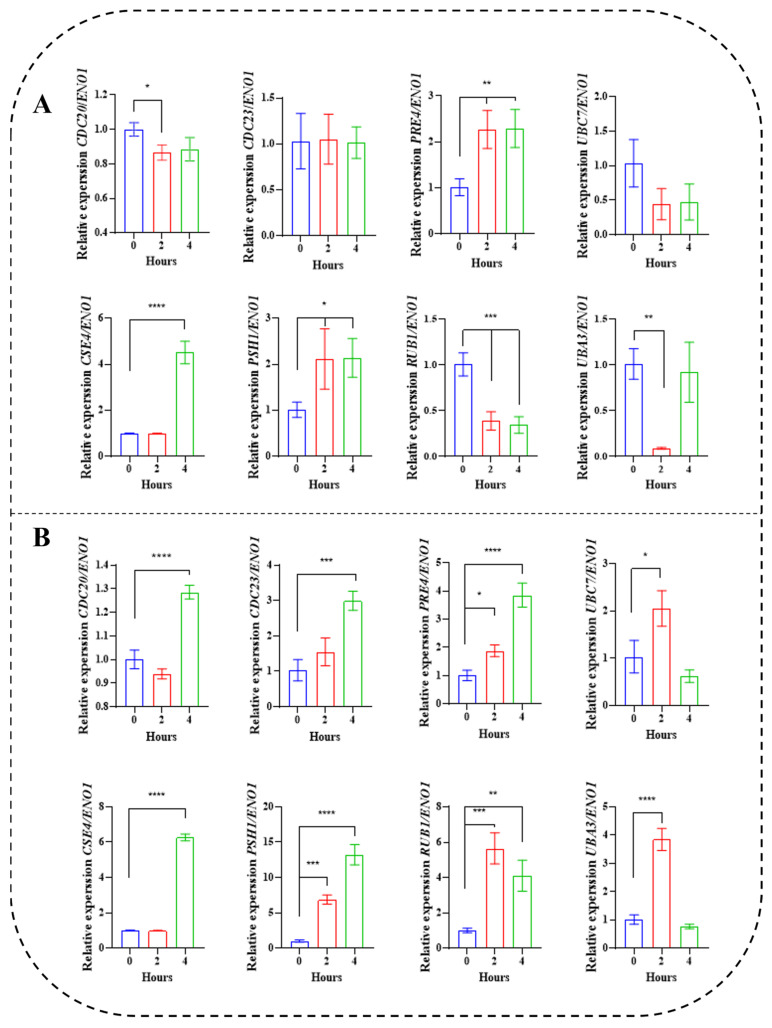
Zygosaccharomyces rouxii used in soy sauce brewing is an osmotolerant and halotolerant yeast, but it is not tolerant to high temperatures and the underlying mechanisms remain poorly understood. Using a synthetic medium containing only Pro as a nitrogen source, the response of Z. rouxii in protein level to high-temperature stress (40 °C, HTS) during the lag phase was investigated. Within the first two h, the total intracellular protein concentration was significantly decreased from 220.99 ± 6.58 μg/mg DCW to 152.63 ± 10.49 μg/mg DCW. The analysis of the amino acid composition of the total protein through vacuum proteolysis technology and HPLC showed that new amino acids (Thr, Tyr, Ser, and His) were added to newborn protein over time during the lag phase under HTS. The nutritional conditions used in this study determined that the main source of amino acid supply for protein synthesis was through amino acid biosynthesis and ubiquitination-mediated protein degradation. Differential expression analysis of the amino acid biosynthesis-related genes in the transcriptome showed that most genes were upregulated under HTS, excluding ARO8, which was consistently repressed during the lag phase. RT-qPCR results showed that high-temperature stress significantly increased the upregulation of proteolysis genes, especially PSH1 (E3 ubiquitin ligase) by 13.23 ± 1.44 fold (p < 0.0001) within 4 h. Overall, these results indicated that Z. rouxii adapt to prolonged high temperatures stress by altering its basal protein composition. This protein renewal was related to the regulation of proteolysis and the biosynthesis of amino acids.
Keywords: Zygosaccharomyces rouxii; amino acid biosynthesis; amino acid composition of proteins; high temperature; ubiquitin–proteasome system.
Conflict of interest statement
The authors declare no conflict of interest.
Figures

Similar articles
-
High Glucose Is a Stimulation Signal of the Salt-Tolerant Yeast Zygosaccharomyces rouxii on Thermoadaptive Growth.J Fungi (Basel). 2024 Feb 28;10(3):185. doi: 10.3390/jof10030185. J Fungi (Basel). 2024. PMID: 38535194 Free PMC article.
-
Metabolic characteristics of intracellular trehalose enrichment in salt-tolerant Zygosaccharomyces rouxii.Front Microbiol. 2022 Aug 2;13:935756. doi: 10.3389/fmicb.2022.935756. eCollection 2022. Front Microbiol. 2022. PMID: 35983337 Free PMC article.
-
[Metabolism of ethyl carbamate precursors in soy sauce by Zygosaccharomyces rouxii ZQ02Metabolism of ethyl carbamate precursors in soy sauce by Zygosaccharomyces rouxii ZQ02].Wei Sheng Wu Xue Bao. 2016 Jun 4;56(6):956-63. Wei Sheng Wu Xue Bao. 2016. PMID: 29727552 Chinese.
-
Adaptive response and tolerance to sugar and salt stress in the food yeast Zygosaccharomyces rouxii.Int J Food Microbiol. 2014 Aug 18;185:140-57. doi: 10.1016/j.ijfoodmicro.2014.05.015. Epub 2014 May 25. Int J Food Microbiol. 2014. PMID: 24973621 Review.
-
The revenge of Zygosaccharomyces yeasts in food biotechnology and applied microbiology.World J Microbiol Biotechnol. 2021 May 10;37(6):96. doi: 10.1007/s11274-021-03066-7. World J Microbiol Biotechnol. 2021. PMID: 33969449 Review.
Cited by
-
Exogenous Trehalose Assists Zygosaccharomyces rouxii in Resisting High-Temperature Stress Mainly by Activating Genes Rather than Entering Metabolism.J Fungi (Basel). 2024 Dec 5;10(12):842. doi: 10.3390/jof10120842. J Fungi (Basel). 2024. PMID: 39728338 Free PMC article.
References
-
- Wallace E.W., Kear-Scott J.L., Pilipenko E.V., Schwartz M.H., Laskowski P.R., Rojek A.E., Katanski C.D., Riback J.A., Dion M.F., Franks A.M., et al. Reversible, Specific, Active Aggregates of Endogenous Proteins Assemble upon Heat Stress. Cell. 2015;162:1286–1298. doi: 10.1016/j.cell.2015.08.041. - DOI - PMC - PubMed
-
- Burns G.D., Hilal O.E., Sun Z., Reutter K.-R., Preston G.M., Augustine A.A., Brodsky J.L., Guerriero C.J. Distinct classes of misfolded proteins differentially affect the growth of yeast compromised for proteasome function. FEBS Lett. 2021;595:2383–2394. doi: 10.1002/1873-3468.14172. - DOI - PMC - PubMed
-
- Kuechler E.R., Rose A., Bolten M., Madero A., Kammoonah S., Colborne S., Gsponer J., Morin G.B., Mayor T. Protein feature analysis of heat shock induced ubiquitination sites reveals preferential modification site localization. J. Proteom. 2021;239:104182. doi: 10.1016/j.jprot.2021.104182. - DOI - PubMed
Grants and funding
LinkOut - more resources
Full Text Sources
