

Echo time-dependent observed T1 and quantitative perfusion in chronic obstructive pulmonary disease using magnetic resonance imaging
- PMID: 38249975
- PMCID: PMC10797117
- DOI: 10.3389/fmed.2023.1254003
Echo time-dependent observed T1 and quantitative perfusion in chronic obstructive pulmonary disease using magnetic resonance imaging
Abstract
Introduction: Due to hypoxic vasoconstriction, perfusion is interesting in the lungs. Magnetic Resonance Imaging (MRI) perfusion imaging based on Dynamic Contrast Enhancement (DCE) has been demonstrated in patients with Chronic Obstructive Pulmonary Diseases (COPD) using visual scores, and quantification methods were recently developed further. Inter-patient correlations of echo time-dependent observed T1 [T1(TE)] have been shown with perfusion scores, pulmonary function testing, and quantitative computed tomography. Here, we examined T1(TE) quantification and quantitative perfusion MRI together and investigated both inter-patient and local correlations between T1(TE) and quantitative perfusion.
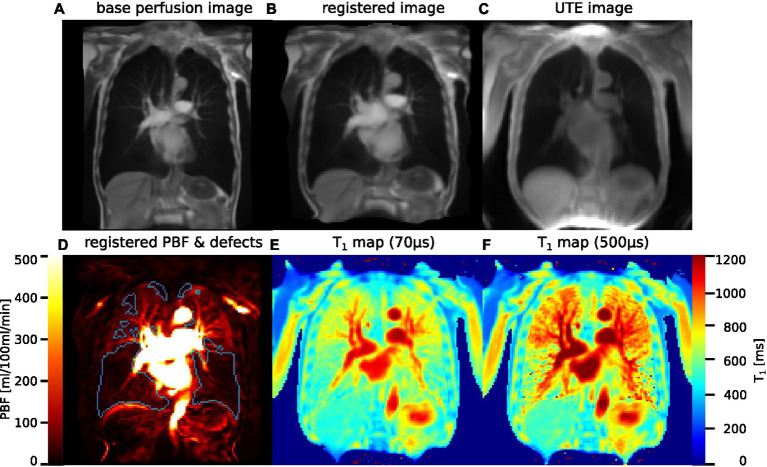
Methods: 22 patients (age 68.0 ± 6.2) with COPD were examined using morphological MRI, inversion recovery multi-echo 2D ultra-short TE (UTE) in 1-2 slices for T1(TE) mapping, and 4D Time-resolved angiography With Stochastic Trajectories (TWIST) for DCE. T1(TE) maps were calculated from 2D UTE at five TEs from 70 to 2,300 μs. Pulmonary Blood Flow (PBF) and perfusion defect (QDP) maps were produced from DCE measurements. Lungs were automatically segmented on UTE images and morphological MRI and these segmentations registered to DCE images. DCE images were separately registered to UTE in corresponding slices and divided into corresponding subdivisions. Spearman's correlation coefficients were calculated for inter-patient correlations using the entire segmented slices and for local correlations separately using registered images and subdivisions for each TE. Median T1(TE) in normal and defect areas according to QDP maps were compared.
Results: Inter-patient correlations were strongest on average at TE2 = 500 μs, reaching up to |ρ| = 0.64 for T1 with PBF and |ρ| = 0.76 with QDP. Generally, local correlations of T1 with PBF were weaker at TE2 than at TE1 or TE3 and with maximum values of |ρ| = 0.66 (from registration) and |ρ| = 0.69 (from subdivision). In 18 patients, T1 was shorter in defect areas than in normal areas, with the relative difference smallest at TE2.
Discussion: The inter-patient correlations of T1 with PBF and QDP found show similar strength and TE-dependence as those previously reported for visual perfusion scores and quantitative computed tomography. The local correlations and median T1 suggest that not only base T1 but also the TE-dependence of observed T1 in normal areas is closer to that found previously in healthy volunteers than in defect areas.
Keywords: T1 mapping; chronic obstructive pulmonary disease; dynamic contrast enhancement; functional lung imaging; lung T1; magnetic resonance imaging; quantitative perfusion.
Copyright © 2024 Triphan, Konietzke, Biederer, Eichinger, Vogelmeier, Jörres, Kauczor, Heußel, Jobst and Wielpütz.
Conflict of interest statement
MK was an employee of Boehringer Ingelheim. The remaining authors declare that the research was conducted in the absence of any commercial or financial relationships that could be construed as a potential conflict of interest.
Figures


Similar articles
-
Echo Time-Dependent Observed Lung T1 in Patients With Chronic Obstructive Pulmonary Disease in Correlation With Quantitative Imaging and Clinical Indices.J Magn Reson Imaging. 2021 Nov;54(5):1562-1571. doi: 10.1002/jmri.27746. Epub 2021 May 28. J Magn Reson Imaging. 2021. PMID: 34050576
-
Influence of echo time on pulmonary ventilation and perfusion derived by phase-resolved functional lung (PREFUL) MRI using multi-echo ultrashort echo time acquisition.NMR Biomed. 2024 Dec;37(12):e5270. doi: 10.1002/nbm.5270. Epub 2024 Oct 4. NMR Biomed. 2024. PMID: 39367655
-
Comparison of quantitative regional perfusion-weighted phase resolved functional lung (PREFUL) MRI with dynamic gadolinium-enhanced regional pulmonary perfusion MRI in COPD patients.J Magn Reson Imaging. 2019 Apr;49(4):1122-1132. doi: 10.1002/jmri.26342. Epub 2018 Oct 22. J Magn Reson Imaging. 2019. PMID: 30350440
-
Outracing Lung Signal Decay - Potential of Ultrashort Echo Time MRI.Rofo. 2019 May;191(5):415-423. doi: 10.1055/a-0715-2246. Epub 2018 Sep 26. Rofo. 2019. PMID: 30257269 English.
-
Proton MRI of the Lung: How to Tame Scarce Protons and Fast Signal Decay.J Magn Reson Imaging. 2021 May;53(5):1344-1357. doi: 10.1002/jmri.27122. Epub 2020 Mar 12. J Magn Reson Imaging. 2021. PMID: 32166832 Review.
References
LinkOut - more resources
Full Text Sources