

The hemodynamic response function as a type 2 diabetes biomarker: a data-driven approach
- PMID: 38250018
- PMCID: PMC10796780
- DOI: 10.3389/fninf.2023.1321178
The hemodynamic response function as a type 2 diabetes biomarker: a data-driven approach
Abstract
Introduction: There is a need to better understand the neurophysiological changes associated with early brain dysfunction in Type 2 diabetes mellitus (T2DM) before vascular or structural lesions. Our aim was to use a novel unbiased data-driven approach to detect and characterize hemodynamic response function (HRF) alterations in T2DM patients, focusing on their potential as biomarkers.
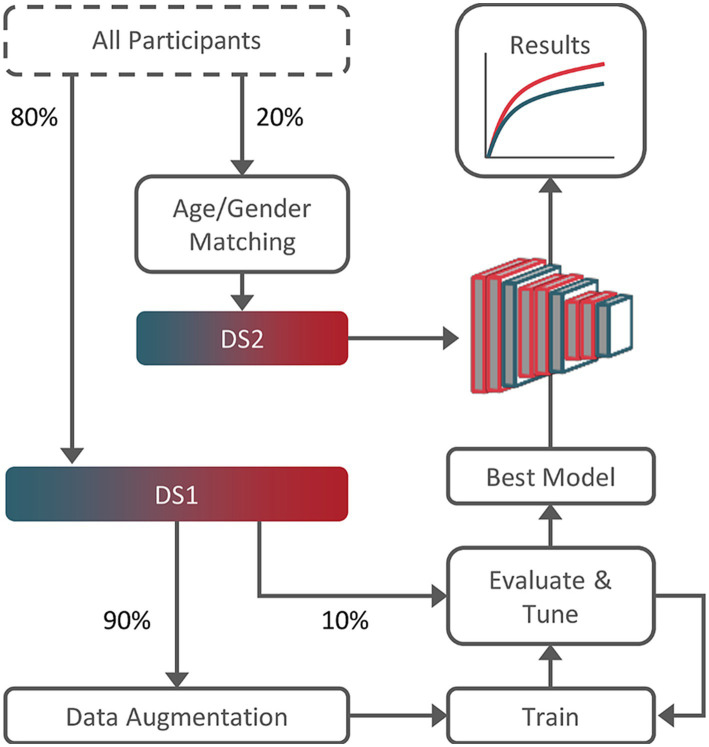
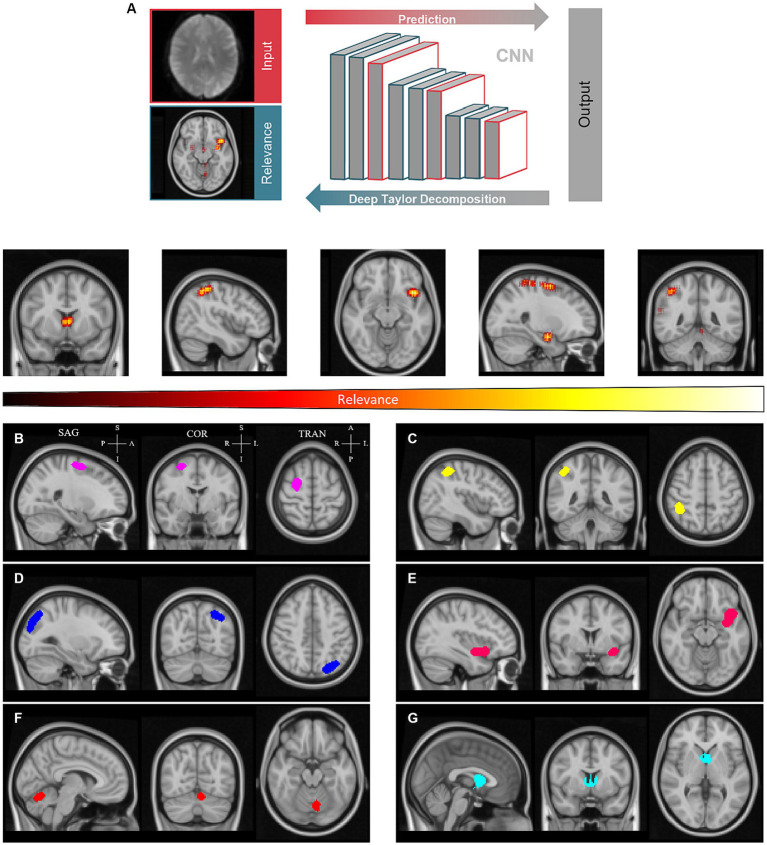
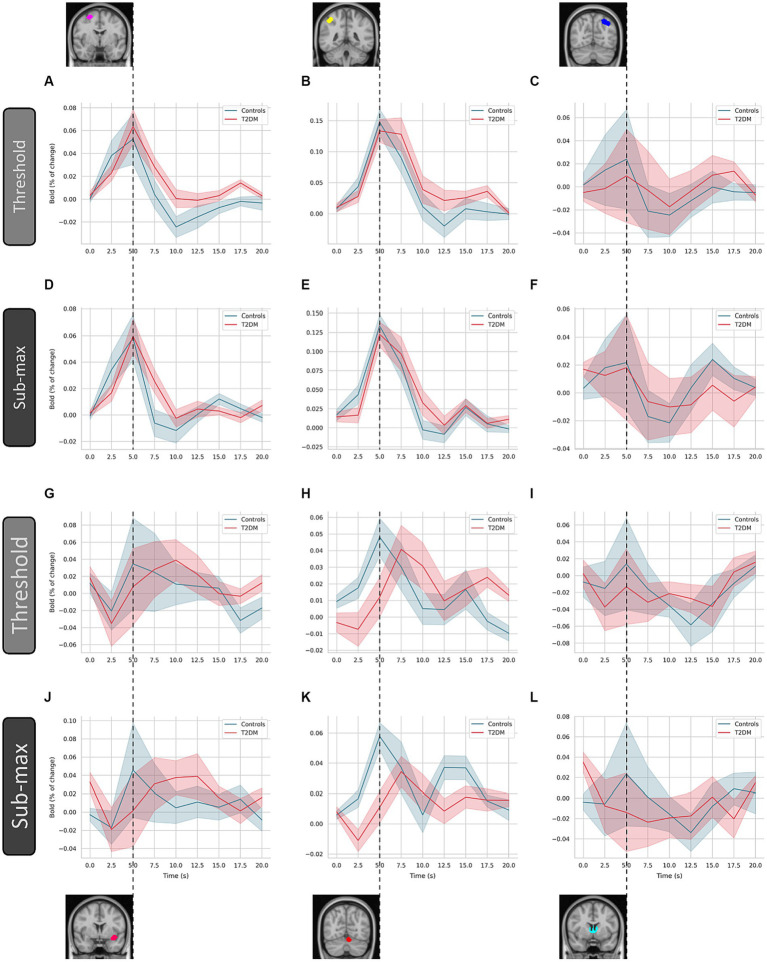
Methods: We meshed task-based event-related (visual speed discrimination) functional magnetic resonance imaging with DL to show, from an unbiased perspective, that T2DM patients' blood-oxygen-level dependent response is altered. Relevance analysis determined which brain regions were more important for discrimination. We combined explainability with deconvolution generalized linear model to provide a more accurate picture of the nature of the neural changes.
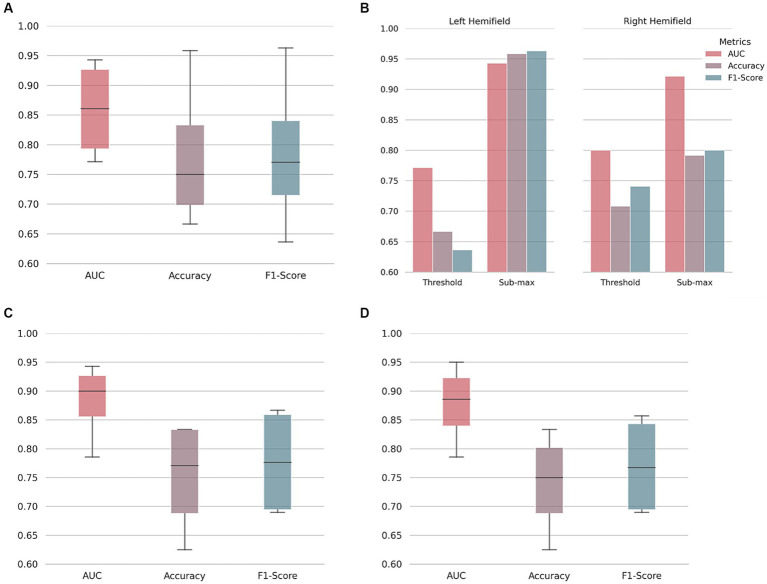
Results: The proposed approach to discriminate T2DM patients achieved up to 95% accuracy. Higher performance was achieved at higher stimulus (speed) contrast, showing a direct relationship with stimulus properties, and in the hemispherically dominant left visual hemifield, demonstrating biological interpretability. Differences are explained by physiological asymmetries in cortical spatial processing (right hemisphere dominance) and larger neural signal-to-noise ratios related to stimulus contrast. Relevance analysis revealed the most important regions for discrimination, such as extrastriate visual cortex, parietal cortex, and insula. These are disease/task related, providing additional evidence for pathophysiological significance. Our data-driven design allowed us to compute the unbiased HRF without assumptions.
Conclusion: We can accurately differentiate T2DM patients using a data-driven classification of the HRF. HRF differences hold promise as biomarkers and could contribute to a deeper understanding of neurophysiological changes associated with T2DM.
Keywords: deep learning; functional magnetic resonance imaging; hemodynamic response; neuroimaging; type 2 diabetes.
Copyright © 2024 Guimarães, Serranho, Duarte, Crisóstomo, Moreno, Gomes, Bernardes and Castelo-Branco.
Conflict of interest statement
The authors declare that the research was conducted in the absence of any commercial or financial relationships that could be construed as a potential conflict of interest.
Figures
Similar articles
-
Changes in hemodynamic response function components reveal specific changes in neurovascular coupling in type 2 diabetes.Front Physiol. 2023 Jan 10;13:1101470. doi: 10.3389/fphys.2022.1101470. eCollection 2022. Front Physiol. 2023. PMID: 36703928 Free PMC article.
-
Early disrupted neurovascular coupling and changed event level hemodynamic response function in type 2 diabetes: an fMRI study.J Cereb Blood Flow Metab. 2015 Oct;35(10):1671-80. doi: 10.1038/jcbfm.2015.106. Epub 2015 Jun 10. J Cereb Blood Flow Metab. 2015. PMID: 26058698 Free PMC article.
-
Resting-state fMRI signals contain spectral signatures of local hemodynamic response timing.Elife. 2023 Aug 11;12:e86453. doi: 10.7554/eLife.86453. Elife. 2023. PMID: 37565644 Free PMC article.
-
Hemodynamic responses in neural circuitries for detection of visual target and novelty: An event-related fMRI study.Hum Brain Mapp. 2007 Apr;28(4):263-74. doi: 10.1002/hbm.20319. Hum Brain Mapp. 2007. PMID: 17133387 Free PMC article.
-
Changes of brain function in patients with type 2 diabetes mellitus measured by different analysis methods: A new coordinate-based meta-analysis of neuroimaging.Front Neurol. 2022 Aug 24;13:923310. doi: 10.3389/fneur.2022.923310. eCollection 2022. Front Neurol. 2022. PMID: 36090859 Free PMC article.
Cited by
-
Evidence for control of cerebral neurovascular function by circulating platelets in healthy older adults.J Physiol. 2025 Jun;603(11):3379-3404. doi: 10.1113/JP288405. Epub 2025 May 28. J Physiol. 2025. PMID: 40434152 Free PMC article.
References
LinkOut - more resources
Full Text Sources