. 2024 Jan 5:17:1270535.
doi: 10.3389/fnana.2023.1270535. eCollection 2023.

Revisiting the two rhythm generators for respiration in lampreys

Affiliations

Revisiting the two rhythm generators for respiration in lampreys

Kianoush Missaghi et al. Front Neuroanat. .

Abstract

In lampreys, respiration consists of a fast and a slow rhythm. This study was aimed at characterizing both anatomically and physiologically the brainstem regions involved in generating the two rhythms. The fast rhythm generator has been located by us and others in the rostral hindbrain, rostro-lateral to the trigeminal motor nucleus. More recently, this was challenged by researchers reporting that the fast rhythm generator was located more rostrally and dorsomedially, in a region corresponding to the mesencephalic locomotor region. These contradictory observations made us re-examine the location of the fast rhythm generator using anatomical lesions and physiological recordings. We now confirm that the fast respiratory rhythm generator is in the rostro-lateral hindbrain as originally described. The slow rhythm generator has received less attention. Previous studies suggested that it was composed of bilateral, interconnected rhythm generating regions located in the caudal hindbrain, with ascending projections to the fast rhythm generator. We used anatomical and physiological approaches to locate neurons that could be part of this slow rhythm generator. Combinations of unilateral injections of anatomical tracers, one in the fast rhythm generator area and another in the lateral tegmentum of the caudal hindbrain, were performed to label candidate neurons on the non-injected side of the lateral tegmentum. We found a population of neurons extending from the facial to the caudal vagal motor nuclei, with no clear clustering in the cell distribution. We examined the effects of stimulating different portions of the labeled population on the respiratory activity. The rostro-caudal extent of the population was arbitrarily divided in three portions that were each stimulated electrically or chemically. Stimulation of either of the three sites triggered bursts of discharge characteristic of the slow rhythm, whereas inactivating any of them stopped the slow rhythm. Substance P injected locally in the lateral tegmentum accelerated the slow respiratory rhythm in a caudal hindbrain preparation. Our results show that the fast respiratory rhythm generator consists mostly of a population of neurons rostro-lateral to the trigeminal motor nucleus, whereas the slow rhythm generator is distributed in the lateral tegmentum of the caudal hindbrain.

Keywords: DAMGO; brainstem; electrophysiology; lamprey; neuroanatomy; respiration; respiratory generator; substance P.


Conflict of interest statement

The authors declare that the research was conducted in the absence of any commercial or financial relationships that could be construed as a potential conflict of interest.

Figures
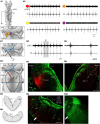
FIGURE 1
FIGURE 1
Anatomical localization of the fast rhythm generator, the pTRG, in the rostral hindbrain by electrophysiology and marker injections. (A1) The rostral hindbrain was probed from its dorsal aspect with an extracellular electrode to locate the region with the optimal pTRG signal. The search focused on the area around cell I1 (violet in A1), which was visualized by cutting open the dorsal midline portion of the isthmus. No areas around cell I1 showed any rhythmical activity (A2, trace with violet circle). On the other hand, a clear signal (A2, trace with red circle) was easily and reproducibly obtained when the electrode was lowered underneath the alar plate, following a somewhat steep angle through the sulcus limitans aiming at more ventral levels, in the area rostro-lateral to the trigeminal motor nucleus (red spot in A1). This optimal area was relatively small, and slightly moving the electrode away from this area in all directions saw the signal decrease (orange in A1,A2) or disappear altogether (yellow in A1,A2). All recordings shown in panel (A2) are from the same animal. (B1) Anatomical localization of the area generating optimal pTRG signal in the transverse plane in one example animal. An electrode was lowered only once aiming at the location represented by the red spot in A1, at a depth where the pTRG signal was optimal (B2). The signal obtained in this area preceded the respiratory bursts recorded from glossopharyngeal motoneurons (B3). The electrode was removed and quickly replaced with an injection micropipette of the same size filled with Texas Red-dextran amines (B4). The injection micropipette was lowered with the same angle through the visible hole left in the tissue by the recording electrode, until it reached the same depth. A single puff of dextran amines was then delivered to mark the spot. The red labeling left by the dextran amines can be seen (B7) on a cross section of the rostro-lateral hindbrain (B5, at the level of the top black line in B4) near a population of neurons that picked up the dye. Some axonal tracing occurred and neurons on the contralateral side were labeled, in a location corresponding to that of the neurons labeled on the injected side (B5, and arrows in B8). More caudally, on a cross section at the level of the recording from IX motoneurons (B6, at the level of the bottom black line in B4), many labeled axons were seen in the lateral tegmentum, most found near the ventral surface (arrow in B9), where respiratory motoneurons show a dense arborization of their distal dendrites (arrow in B10). The motoneurons in B10 were labeled after an injection of biocytin (green) in the glossopharyngeal nerve in the periphery (different animal). The green labeling in B7–B9, is a fluorescent Nissl staining. ARRN, anterior rhombencephalic reticular nucleus; I1, isthmic cell 1; I2, isthmic cell 2; IX, glossopharyngeal motor nucleus; mes, mesencephalon; NOMA, nucleus octavomotor anterior; nV, trigeminal nerve; nVm, trigeminal motor nerve; nVs, trigeminal sensory nerve; oml, lateral octavo-mesencephalic tract; pTRG, paratrigeminal respiratory group; rdV, descending root of the trigeminal nerve; rhomb, rhombencephalon; sl, sulcus limitans. Scale bars in photomicrographs = 200 μm.
FIGURE 2
FIGURE 2
Respiratory activity in the hindbrain after removal of the mesencephalon and the medial portion of the isthmus. (A) Schematic drawing illustrating the isolated hindbrain preparation with the removal of the medial isthmic region comprising cell I1 and surrounding structures. The respiratory activity was recorded with an extracellular electrode placed over the X motor nucleus. The illustration also indicates the location where biocytin was injected after the electrophysiological experiment. Black lines labeled C and D correspond to the levels of transverse sections photographed in panels (C,D). (B) Neurographic recording of the respiratory rhythm from the vagal motor nucleus showing the persistence of both the fast and slow respiratory rhythms in the absence of the mesencephalon and medial isthmic region. The burst episodes of the slow respiratory rhythm are indicated by green stars. The lower trace corresponds to the shaded area in the upper trace. (C) Photomicrograph of a transverse section at the most caudal level of the medial lesion in the rostral hindbrain. Circles indicate the presence of neurons projecting to the vagal motoneurons in the intact lateral areas at this level, close to the sulcus limitans. (D) Photomicrograph of a transverse section just caudal to the medial rostral lesion showing the intact hindbrain at mid-levels of the trigeminal motor nucleus. Circles indicate the presence of neurons projecting to the vagal motoneurons in the lateral areas at this level, close to the sulcus limitans. I2, isthmic cell 2; V, trigeminal motor nucleus; X, vagal motor nucleus; nV, trigeminal nerve; nIX, glossopharyngeal nerve; nX, vagal nerve. Scale bars in photomicrographs = 500 μm.
FIGURE 3
FIGURE 3
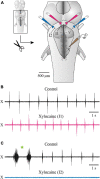
Effects of Xylocaine injections over cells I1 and I2 on respiratory activity recorded from the vagal motor nucleus. (A) Schematic drawing of the isolated brainstem in vitro preparation showing the localization of the bilateral injections of Xylocaine around cells I1 and I2, as well as the position of the extracellular electrode placed over the X motor nucleus. A dorsal midsagittal section was performed at the level of the isthmus (not illustrated), to make sure cell I1 was completely visible for better pipette positioning. (B,C) Neurographic traces illustrating the respiratory activity recorded from the X motor nucleus under control conditions [top traces in panels (B,C)] and following the bilateral injection of Xylocaine over cell I1 area [bottom trace in panel (B)] and over cell I2 area [bottom trace in panel (C)]. One double-burst episode of the slow rhythm is indicated by a green star in panel (C). The pipettes aiming at cell I1 area were positioned on the ependymal surface of the ventricle immediately dorsal to cell I1, while the ones aiming at cell I2 area were lowered through the sulcus limitans underneath the alar plate, as illustrated in Figures 1B1, B4. Note that respiratory activity is abolished when Xylocaine is injected over cell I2 area, but not when injected over cell I1 area. I1, isthmic cell 1; I2, isthmic cell 2; V, trigeminal motor nucleus; X, vagal motor nucleus.
FIGURE 4
FIGURE 4
Neurons retrogradely labeled in the rostral hindbrain after a superficial injection of biocytin in the population of motoneuronal cell bodies of the rostral vagal motor nucleus. (A) Schematic drawing of the brain of an adult lamprey showing the location of the axonal tracer injection in the vagal motor nucleus. The black lines labeled from B to E refer to the level of sectioning of transverse sections illustrated in B to E. The red letters next to the frames in panels (B–E) refer to the photomicrographs in panels (F–J). In all photomicrographs from panels (F–J), the green labeling is biocytin revealed with streptavidin-Alexa Fluor 488. The photomicrograph shown in panel (H) is of a transverse section at the level between that of panels (D,E), or in other words, at a level between panels (G,I). Areas including retrogradely labeled neurons are delimited by a red dashed line in panels (F–I). Retrogradely labeled neurons are found both close to cells I2 [panel (G) is just rostral to the level of cell I2] and I1 [panel (I) is just rostral to the level of cell I1]. ARRN, anterior rhombencephalic reticular nucleus; I1, isthmic cell 1; I2, isthmic cell 2; NOMA, nucleus octavomotor anterior; oml, lateral octavo-mesencephalic tract; rdV, descending root of the trigeminal nerve; rmV, motor root of the trigeminal nerve; sl, sulcus limitans; V, trigeminal motor nucleus; X, vagal motor nucleus. Scale bars in photomicrographs = 200 μm.
FIGURE 5
FIGURE 5
Localization of neurons in the caudal hindbrain (OLA excluded) projecting to the pTRG and the lateral tegmentum on the other side: both injections were made on the same side of the brain. (A1) Schematic drawing of a dorsal view of the whole lamprey brain indicating the location of the injection sites. To the left, photomicrographs illustrating the injection sites on transverse sections for the animal represented in the figure. (A2) 3D rendering of the caudal hindbrain with neurons projecting exclusively to the pTRG in green, exclusively to the lateral tegmentum on the other side in red, and projecting to both in blue. The location of the respiratory VII, IX, and X motor nuclei is indicated by dashed lines. (A3) Representation of the neurons that project exclusively to the pTRG as they appear in panel (A2). (A4) Representation of the neurons that project exclusively to the lateral tegmentum on the other side as they appear in panel (A2). (A5) Representation of the neurons that project to both the contralateral pTRG and contralateral tegmentum as they appear in panel (A2). (B1–B4) Drawings of transverse sections of the caudal hindbrain at the levels indicated on the 3D rendering. The color code is the same as in A. IX, glossopharyngeal motor nucleus; MRRN, middle rhombencephalic reticular nucleus; OLA, octavolateral area; PRRN, posterior rhombencephalic reticular nucleus; pTRG, paratrigeminal respiratory group; rdV, descending root of the trigeminal nerve; VII, facial motor nucleus; X, vagal motor nucleus. Scale bars = 1 mm.
FIGURE 6
FIGURE 6
Neurons in the lateral tegmentum of the caudal hindbrain were retrogradely labeled after tracer injections in the contralateral pTRG and the lateral tegmentum on the other side (see Figure 5A1). (A1,B1,C1) Photomicrographs of neurons projecting to the contralateral pTRG (green), to the contralateral lateral tegmentum (red) and to both [white arrows in panels (A1,A2)]. Refer to Figures 5B1, B2, B4 for the approximate location of the photographic frames. Panels (A2,B2,C2) are enlargements of the areas delineated by a white dashed line in panels (A1,B1,C1), respectively. The blue labeling was obtained with DAPI, which stains DNA in cell nuclei. rdV, descending root of the trigeminal nerve; VII, facial motor nucleus; IX, glossopharyngeal motor nucleus; X, vagal motor nucleus. Scale bars = 50 μm.
FIGURE 7
FIGURE 7
Localization of neurons in the caudal hindbrain (OLA excluded) projecting to the ipsilateral pTRG and the lateral tegmentum on the other side: the two injections were made on opposite sides of the brain. (A1) Schematic drawing of a dorsal view of the whole lamprey brain indicating the location of the injection sites. To the left, photomicrographs of the injection sites on transverse sections from the animal represented in the figure. (A2) 3D rendering of the caudal hindbrain with neurons projecting exclusively to the pTRG in green, exclusively to the lateral tegmentum on the other side in red, and projecting to both in blue. The location of the respiratory VII, IX, and X motor nuclei is indicated by dashed lines. (A3) Representation of the neurons that project exclusively to the pTRG as they appear in panel (A2). (A4) Representation of the neurons that project exclusively to the lateral tegmentum on the other side as they appear in panel (A2). (A5) Representation of the neurons that project to both the ipsilateral pTRG and contralateral tegmentum as they appear in panel (A2). The purple shape in panels (A3,B1–B3), delimits a conspicuous population of neurons with larger cell bodies and ipsilateral projections to the pTRG region. Examples can be seen in Figure 8B1. More details are available in the text. (B1–B4) Drawings of transverse sections of the caudal hindbrain at the levels indicated on the 3D rendering in panels (A2–A5). The color code is the same as in panel (A). IX, glossopharyngeal motor nucleus; MRRN, middle rhombencephalic reticular nucleus; OLA, octavolateral area; PRRN, posterior rhombencephalic reticular nucleus; pTRG, paratrigeminal respiratory group; rdV, descending root of the trigeminal nerve; VII, facial motor nucleus; X, vagal motor nucleus. Scale bars = 1 mm.
FIGURE 8
FIGURE 8
Neurons in the lateral tegmentum of the caudal hindbrain were retrogradely labeled after tracer injections in the ipsilateral pTRG and the lateral tegmentum on the other side (see Figure 7A1). (A1,B1,C1) Photomicrographs of neurons projecting to the pTRG (green), to the lateral tegmentum on the other side (red), and to both (white arrows). Refer to Figures 7B1, B2, B4 for the approximate location of the photographic frames. The purple shape in B1 refers to the corresponding area in Figures 7A3, B1–B3. Panels (A2,B2,C2) are enlargements of the areas delineated by a white dashed line in panels (A1,B1,C1), respectively. The blue labeling was obtained with DAPI, which stains DNA in cell nuclei. rdV, descending root of the trigeminal nerve; VII, facial motor nucleus; IX, glossopharyngeal motor nucleus; X, vagal motor nucleus. Scale bars = 50 μm.
FIGURE 9
FIGURE 9
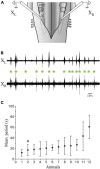
Extracellular recordings of the slow rhythm in the isolated caudal hindbrain preparation. (A) Illustration of the in vitro isolated caudal hindbrain showing the localization of the extracellular electrodes over the respiratory motoneurons on both sides. (B) Neurographic traces illustrating many burst episodes (green stars) of the slow rhythm recorded simultaneously from the left (L) and right (R) X motor nuclei. Note that the fast rhythm is absent. (C) Graph illustrating the mean period (s) of the slow rhythm in 12 animals. The neurographic traces in B are from animal 2 (*). VII, facial motor nucleus; IX, glossopharyngeal motor nucleus; X, vagal motor nucleus.
FIGURE 10
FIGURE 10
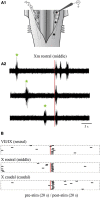
Effects of electrical stimulation of the lateral tegmentum in the isolated caudal hindbrain preparation. (A1) Illustration of the caudal hindbrain preparation showing the localization of the extracellular recordings and the three stimulation sites. (A2) Neurographic traces showing three examples of slow rhythm bursts triggered by the stimulation (red vertical line) of the middle site. Spontaneous slow rhythm burst episodes preceding the stimulation are indicated by green stars. (B) Peristimulus histograms (20 s before and after the stimulation) illustrating the occurrence of extracellular bursts typical of the slow rhythm recorded over the X motor nucleus on one side, following electrical stimulations (3 pulses of 9 μA, 2 ms at a frequency of 30 Hz every 50 s) in the VII and IX motor nuclei (rostral site), the rostral X motor nucleus (middle site) and the caudal X motor nucleus (caudal site) on the opposite side. The histograms are aligned on the stimulation illustrated by the red vertical line. The black bars each represent one slow rhythm burst, with their left end aligned with the onset of the burst. The length of each bar is equal to the mean duration of a triggered burst from the middle site. VII, facial motor nucleus; IX, glossopharyngeal motor nucleus; X, vagal motor nucleus.
FIGURE 11
FIGURE 11
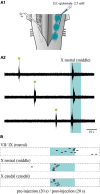
Effects of chemical stimulation of the lateral tegmentum in the isolated caudal hindbrain preparation. (A1) Illustration of the caudal hindbrain preparation, showing the localization of the extracellular recordings and the three sites in which D,L-glutamate (2.5 mM) was injected. (A2) Neurographic traces showing three examples of slow rhythm bursts during the injection (aqua area) in the middle site. Spontaneous slow rhythm burst episodes before the stimulation are indicated by green stars. The traces are aligned with the beginning of the injection. (B) Peristimulus histogram (20 s before and after the stimulation) illustrating the extracellular bursts typical of the slow rhythm recorded over the X motor nucleus, following a series of eight D,L-glutamate injections (5–10 ms pulses at 5 Hz for 10 s every 80 s; 1–3 psi) in the VII and IX motor nuclei (rostral site), the rostral X motor nucleus (middle site) and the caudal X motor nucleus (caudal site) on the opposite side. The histograms are aligned with the injection onset illustrated by the aqua area. The black bars illustrate the onset of the slow rhythm bursts. The length of each bar is equal to the mean duration of a triggered burst from the middle site. VII, facial motor nucleus; IX, glossopharyngeal motor nucleus; X, vagal motor nucleus.
FIGURE 12
FIGURE 12
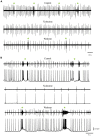
Injections of Xylocaine in the whole-brainstem preparation. The injections were applied bilaterally to the caudal (A) or rostral (B) tegmental sites and abolished the slow rhythm but not the fast. (A) Neurographic traces illustrating respiratory motoneuron activity recorded with an extracellular electrode placed directly over the respiratory motoneurons of the caudal VII/rostral IX motor nuclei. Top: control condition. Middle: after bilateral Xylocaine injection in the caudal site. Bottom: after washout. (B) Neurographic traces illustrating respiratory motoneuron activity under control condition (Top), after a bilateral Xylocaine injection in the rostral site (Middle), and after washout (Bottom). Respiration here was recorded with an extracellular electrode placed directly over the respiratory motoneurons in the caudal part of the X motor nucleus (top trace in each condition) and with an intracellular electrode in a respiratory motoneuron located slightly more rostral than the extracellular recording (bottom trace in each condition). The green stars indicate slow rhythm burst episodes, some comprising multiple bursts.
FIGURE 13
FIGURE 13
Effects of glutamate antagonists (CNQX/AP5) and neuropeptides (substance P; DAMGO) on the slow respiratory rhythm in the isolated caudal hindbrain preparation. (A) Neurographic traces illustrating the slow respiratory rhythm under control, bath-application of glutamatergic antagonists, and washout conditions. (B) Neurographic traces illustrating the slow respiratory rhythm under control, bath-application of substance P, and washout conditions. (C) Neurographic traces illustrating the slow respiratory rhythm under control, bilateral micro-injections of DAMGO over the caudal site, and washout conditions. All slow rhythm burst episodes are indicated by green stars.
FIGURE 14
FIGURE 14
Effects of local application of substance P on the slow respiratory rhythm in the isolated caudal hindbrain preparation of adult lampreys. (A) Illustration of the caudal hindbrain preparation showing the localization of the extracellular recording and the area covered by multiple micro-injections of substance P in the lateral tegmentum. (B1) Neurographic traces illustrating the slow respiratory rhythm recorded over the X motor nucleus under control, bilateral micro-injections of substance P in the lateral tegmentum, and washout conditions. The segment of the trace representing the substance P condition was chosen to illustrate the gradual effect of the drug. The portion of the trace under the red bracket corresponds to the region of the graph under the red bracket in panel (C). (B2) The area shaded in tan in panel (B1) was enlarged to reveal episodes (green stars) of single and multiple bursts. (C) Graph showing the period of the slow rhythm bursting episodes (gray dots) before and after local, bilateral application of substance P (aqua arrow) in the lateral tegmentum. The black line represents the moving average of the period (average of 10 episodes of bursts). Inset: Enlarged portion of the graph to highlight the higher frequency of burst episodes following local substance P micro-injection. (D) Histogram illustrating the mean period during 15 min of control (271.4 ± 186.3 s), local, bilateral injection of substance P in the lateral tegmentum (116.4 ± 98.9 s), and washout (296.1 ± 133.6 s) conditions in six adult lampreys. *P < 0.05.
FIGURE 15
FIGURE 15
Proposed neural networks underlying the fast and slow respiratory rhythms in lampreys. Schematic illustration of the adult lamprey brainstem depicting the location of the respiratory rhythm generators. The neural networks and connectivity associated with the fast respiratory rhythm are illustrated in green. The neural networks associated with the slow respiratory rhythm are illustrated in purple. pTRG, paratrigeminal respiratory group; VII, facial motor nucleus; IX, glossopharyngeal motor nucleus; V, trigeminal motor nucleus; X, vagal motor nucleus; MRRN, middle rhombencephalic reticular nucleus; PRRN, posterior rhombencephalic reticular nucleus.

Similar articles

References

    1. Alheid G. F., McCrimmon D. R. (2008). The chemical neuroanatomy of breathing. Respir. Physiol. Neurobiol. 164 3–11. 10.1016/j.resp.2008.07.014 - DOI - PMC - PubMed
    1. Alheid G. F., Milsom W. K., McCrimmon D. R. (2004). Pontine influences on breathing: An overview. Respir. Physiol. Neurobiol. 143 105–114. 10.1016/j.resp.2004.06.016 - DOI - PubMed
    1. Anderson T. M., Garcia A. J., Baertsch N. A., Pollak J., Bloom J. C., Wei A. D., et al. (2016). A novel excitatory network for the control of breathing. Nature 536 76–80. 10.1038/nature18944 - DOI - PMC - PubMed
    1. Arata A., Tanaka I., Fujii M., Ezure K. (2010). “Active inspiratory-expiratory phase switching mechanism exists in the neonatal nucleus parabrachialis,” in New Frontiers in Respiratory Control Advances in Experimental Medicine and Biology, eds Homma I., Onimaru H., Fukuchi Y. (New York, NY: Springer; ), 135–138. 10.1007/978-1-4419-5692-7_27 - DOI - PubMed
    1. Auclair F., Lund J. P., Dubuc R. (2004). Immunohistochemical distribution of tachykinins in the CNS of the lamprey Petromyzon marinus. J. Comp. Neurol. 479 328–346. 10.1002/cne.20324 - DOI - PubMed

LinkOut - more resources