. 2024 Jan 12;14(3):1126-1146.
doi: 10.7150/thno.90792. eCollection 2024.

Morphine- and foot shock-responsive neuronal ensembles in the VTA possess different connectivity and biased GPCR signaling pathway

Affiliations

Morphine- and foot shock-responsive neuronal ensembles in the VTA possess different connectivity and biased GPCR signaling pathway

Fan Wang et al. Theranostics. .

Abstract

Background: Neurons in the ventral tegmental area (VTA) are sensitive to stress and their maladaptation have been implicated in the psychiatric disorders such as anxiety and addiction, etc. The cellular properties of the VTA neurons in response to different stressors related to different emotional processing remain to be investigated. Methods: By combining immediate early gene (IEG)-dependent labeling, rabies virus tracing, ensemble-specific transcriptomic analysis and fiber photometry recording in the VTA of male mice, the spatial distribution, brain-wide connectivity and cellular signaling pathways in the VTA neuronal ensembles in response to morphine (Mor-Ens) or foot shock (Shock-Ens) stimuli were investigated. Results: Optogenetic activation of the Mor-Ens drove approach behavior, whereas chemogenetic activation of the Shock-Ens increased the anxiety level in mice. Mor-Ens were clustered and enriched in the ventral VTA, contained a higher proportion of dopaminergic neurons, received more inputs from the dorsal medial striatum and the medial hypothalamic zone, and exhibited greater axonal arborization in the zona incerta and ventral pallidum. Whereas Shock-Ens were more dispersed, contained a higher proportion of GABAergic neurons, and received more inputs from the ventral pallidum and the lateral hypothalamic area. The downstream targets of the G protein and β-arrestin pathways, PLCβ3 and phosphorylated AKT1Thr308, were relatively enriched in the Mor-Ens and Shock-Ens, respectively. Cariprazine, the G-protein-biased agonist for the dopamine D2 receptor, increased the response of Mor-Ens to sucrose water and decreased the anxiety-like behavior during morphine withdrawal, whereas the β-arrestin-biased agonist UNC9994 decreased the response of Shock-Ens to tail suspension. Conclusions: Taken together, these findings reveal the heterogeneous connectivity and signaling pathways of the VTA neurons in response to morphine and foot shock, providing new insights for development of specific interventions for psychiatric disorders caused by various stressors associated with different VTA neuronal functions.

Keywords: Ensemble; Foot shock; GPCR; Morphine; Ventral tegmental area.


Conflict of interest statement

Competing Interests: The authors have declared that no competing interest exists.

Figures

Figure 1
Figure 1
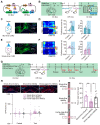
The distinct distributions of the VTA ensembles in response to morphine or foot shock. (A) Schematic of the experimental procedure for c-Fos staining. Mice were perfused and immunostained at 90 min after receiving morphine (10 mg/kg, i.p.), foot shocks (6 times, 0.75 mA, 2 s) or home-cage control. (B) Representative images of c-Fos immunostaining of the VTA along the anterior-posterior axis. Red: c-Fos; Blue: DAPI. Scale bar, 200 μm. Dashed lines: outline of the VTA. (C) Left, quantification of c-Fos+ cells (number per mm2) along the anterior-posterior axis in the VTA. Right, quantification of the percentage of c-Fos+ cells (normalized to the total number of c-Fos+ cells in the VTA). [Two-way RM ANOVA: Home-cage-Ens n = 7, Shock-Ens n = 6, Mor-Ens n = 4. Left: F treatment × session (14, 92) = 11.28, P < 0.001; Right: F treatment × session (14, 106) = 5.929, P < 0.001]. (D-I) Quantification (% total counts in a section) of Mor-Ens, Shock-Ens and Home-cage-Ens along the mid-lateral axis of VTA. [Two-way RM ANOVA (D-I): (D) Home-cage-Ens n = 7, Shock-Ens n = 6, Mor-Ens n = 4, F treatment × session (2.744, 19.206) = 5.929, P = 0.117. (E) F treatment × session (2.545, 16.545) = 2.708, P = 0.086. (F) F treatment × session (2.377, 15.448) = 2.708, P = 0.413. (G) F treatment × session (4, 28) = 3.238, P = 0.026; Bonferroni post hoc, ML (0.6 ~) home-cage vs morphine P = 0.020. (H) Home-cage-Ens n = 5, Shock-Ens n = 6, Mor-Ens n = 4, F treatment × session (4, 24) = 7.299, P = 0.001; Bonferroni post hoc, ML (0 ~ 0.3) home-cage vs morphine P = 0.004, ML (0.6 ~) home-cage vs morphine P = 0.001, ML (0.6 ~) morphine vs shock P = 0.011. (I) Home-cage-Ens n = 7, Shock-Ens n = 6, Mor-Ens n = 4, F treatment × session (4, 28) = 9.277, P < 0.001; Bonferroni post hoc, ML (0 ~ 0.3) home-cage vs morphine P < 0.001, ML (0 ~ 0.3) shock vs morphine P = 0.007, ML (0.3 ~ 0.6) home-cage vs morphine P = 0.003, ML (0.3 ~ 0.6) shock vs morphine P = 0.043]. (J) Representative 3D distribution mapping of Home-cage-Ens, Mor-Ens and Shock-Ens in the VTA. Black dots: Home-cage-Ens; Purple dots: Shock-Ens; Blue dots: Mor-Ens. (K) Cumulative probability curves and the violin plots depict distributions of the distances from the bottom of the VTA (-3.5 mm). [Kruskal-Wallis H Test: Home-cage-Ens n = 270 cells from 7 mice, Shock-Ens n = 374 cells from 4 mice, Mor-Ens n = 542 cells from 4 mice, H = 77.457, P < 0.001; Bonferroni post hoc: home-cage vs morphine P < 0.001, shock vs morphine P < 0.001]. (L) Cumulative probability curves and the violin plot depict distributions of the distances between two c-Fos+ cells in the VTA (-3.5 mm) [Kruskal-Wallis H Test: Home-cage-Ens n = 1000 paired distances from 7 mice, Shock-Ens n = 1000 paired distances from 4 mice, Mor-Ens n = 1000 paired distances from 4 mice, H = 68.955, P < 0.001; Bonferroni post hoc: home-cage vs morphine P < 0.001, shock vs morphine P < 0.001]. *P < 0.05, **P < 0.01, ***P < 0.001. Data are shown as mean ± SEM.
Figure 2
Figure 2
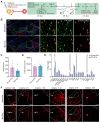
Activation of the VTA Mor-Ens and VTA Shock-Ens lead to place preference and increased anxiety level, respectively. (A) Diagram of the Cre-dependent Robust Activity Marking (CRAM) system. (B) Schematic of experimental procedure for ChR2 tagging in the VTA ensembles and the RTPP/A task. The mice received optogenetic stimulation (473 nm, 10 mW, 20 Hz, 5 ms) when entered the paired chamber. (C, E) Left, diagram of optogenetic activation of the VTA neuronal ensembles. Right, representative images of ChR2 or EGFP expressing in the VTA. Dashed lines: outline of the VTA and optic fiber trace. Green: EGFP; Blue: DAPI. Scale bar: 200 μm. (D, F) Left, representative heat maps of RTPP/A. Middle, quantification of preference score. Right, quantification of bouts (Frequency of entering the chamber paired with laser). [Paired t-test: (D) Middle, Mor-Ens n = 10, t (9) = -4.486, P = 0.002; Right, Mor-Ens n = 10, t (9) = 0.900, P = 0.392; (F) Middle, Shock-Ens n = 9, t (8) = 0.709, P = 0.498; Wilcoxon Signed Ranks Test: (F) Right, Shock-Ens n = 9, Z = -0.841, P = 0.400]. (G) Schematic of the experimental procedure for the virus injection and the behavior test. Mice were injected with CNO (2 mg/kg, i.p.) 30 min before the test. (H) Chemogenetic activation of the VTA Shock-Ens or Home-cage-Ens did not result in a preference/avoidance for the CNO-paired chamber. Top, representative images of hM3Dq or mCherry expressing in the VTA. Dashed lines: outline of the VTA. Red: hM3Dq or mCherry; Blue: DAPI. Scale bar: 200 μm. [Two-way RM ANOVA: Shock-Ens mCherry n = 13, Shock-Ens hM3Dq n = 13, Home-cage-Ens hM3Dq n = 13, F treatment × session (2, 36) = 0.916, P = 0.409]. (I) Chemogenetic activation of Shock-Ens reduced the time spent in the open arms in the elevated plus maze (EPM) task. Left, Representative tracks during the 6 min EPM task. The areas surrounded by the solid line are closed arms. The areas surrounded by the dashed lines are open arms. The red line represents the mouse tracks. Right, time spent in the open arms. [One-way ANOVA: Shock-Ens mCherry n = 15, Shock-Ens hM3Dq n = 14, Home-cage-Ens hM3Dq n = 13, F treatment × session (2, 39) = 6.022, P = 0.005; Bonferroni post hoc: Shock-Ens hM3Dq vs Shock-Ens mCherry, P = 0.004; Shock-Ens hM3Dq vs Home-cage-Ens hM3Dq, P = 0.039]. *P < 0.05, **P < 0.01, ***P < 0.001. Data are shown as mean ± SEM.
Figure 3
Figure 3
Mor-Ens and Shock-Ens in the VTA contain different proportions of dopaminergic and GABAergic neurons. (A) Schematic of the experimental procedure for immunofluorescence staining. IF: immunofluorescence (B) Representative images of TH staining in the VTA. Green: EGFP; Red: TH. Scale bar: left 100 μm, right 50 μm. The dashed line represents the boundary of the VTA and the enlarged area. White arrows indicate the TH+ EGFP+ cells. (C) The percentage of TH+ cells in EGFP+ ensembles along rostral-caudal axis of the VTA. [Two-way RM ANOVA: Shock-Ens n = 8, Mor-Ens n = 7, F treatment × session (4, 39) = 3.857, P < 0.001. Bonferroni post hoc: ML (-3.1, -3.2), P = 0.013; ML (-3.2, -3.3), P = 0.002; ML (-3.3, -3.4), P = 0.004]. (D) The percentage of TH+ cells in EGFP+ ensembles in the VTA. [Two-tailed Student's t-test: Shock-Ens n = 8, Mor-Ens n = 7, t (13) = -4.645, P < 0.001]. (E) Representative images of GABA staining in the VTA. Green: EGFP; Red: GABA. Scale bar: left 100 μm, right 50 μm. The dashed line represents the boundary of the VTA and the enlarged VTA area. White arrows indicate the GABA+EGFP+ cells. (F) The percentage of GABA+ cells in EGFP+ ensembles along rostral-caudal axis of the VTA. [Two-way RM ANOVA: (F) Shock-Ens n = 7, Mor-Ens n = 7, F treatment × session (4, 48) = 0.438, P = 0.780, F ensembles (1, 12) = 17.848, P = 0.001. Bonferroni post hoc: ML (-3.2, -3.3), P = 0.014; ML (-3.4, -3.5), P = 0.008; ML (-3.5, -3.6), P = 0.019]. (G) The percentage of GABA+ cells in EGFP+ ensembles in the VTA. [Two-tailed Student's t-test: Shock-Ens n = 7, Mor-Ens n = 7, t (12) = 4.433, P = 0.001]. *P < 0.05, **P < 0.01, ***P < 0.001. Data are shown as mean ± SEM.
Figure 4
Figure 4
Rabies virus-mediated monosynaptic tracing of the inputs onto Mor-Ens or Shock-Ens in the VTA. (A) Schematic of the rabies-mediated monosynaptic retrograde labeling of the inputs onto VTA Mor-Ens or Shock-Ens. Mice were injected with dsRed-expressing rabies virus after Mor-Ens or Shock-Ens labeling and the brains were collected 7 days later. (B) Representative confocal images of the VTA starter neurons. Green: TVA-EGFP; Red: RVΔG-dsRed; Blue: DAPI. Scale bars: left 200 μm, right 50 μm. Dashed lines: outline of VTA. White arrows indicate EGFP+dsRed+ starter neurons in the VTA. (C) Quantification of the total number of starter neurons (EGFP+dsRed+) in the VTA. [Two-tailed Student's t-test: Shock-Ens n = 6, Mor-Ens n = 7, t (11) = 1.347, P = 0.205]. (D) Quantification of the inputs (dsRed+ cells) in 20 brain regions. [Two-tailed Student's t-test: Shock-Ens n = 6, Mor-Ens n = 7, t (11) = 0.861, P = 0.408]. (E) DsRed+ inputs of each brain region relative to total dsRed+. [Two-way RM ANOVA: Shock-Ens n = 6, Mor-Ens n = 7, F treatment × session (4.417, 48.592) = 2.927, P = 0.026, Fisher's LSD post hoc: DMStr, P = 0.014; VP, P = 0.002; LHb, P = 0.015; MEZ, P = 0.020]. (F) Representative images of the inputs (dsRed+ cells) from selected brain regions. Red: dsRed. Dashed lines: outline of brain regions. Scale bars, 500 μm for DMStr; 200 μm for VP and MEZ; 100 μm for LHb; 250 μm for Acbc and LH. *P < 0.05, **P < 0.01, ***P < 0.001. Data are shown as mean ± SEM.
Figure 5
Figure 5
ZI and VP receive more afferences from Mor-Ens than from Shock-Ens. (A) Schematic of the experimental procedure to label the Mor-Ens or Shock-Ens in the VTA. (B) Representative images of EGFP+ ensembles in the VTA. Green: EGFP; Blue: DAPI. Scale bar: left 1000 μm, right 100 μm. (C-E) Left: quantitative analysis of the axonal projections from VTA Mor-Ens and Shock Ens in 25 target brain regions. Right: the importance ranking of 25 target brain regions based on random forest algorithm. [Two-tailed Student's t-test: Shock-Ens n = 5, Mor-Ens n = 4, (C) VP: t (7) = -4.364, P = 0.003, ZI: t (7) = -2.563, P = 0.037; (D) ZI: t (7) = -2.599, P = 0.035; (E) Gpe: t (7) = -3.406, P = 0.011, ZI: t (7) = -2.673, P = 0.032, LDT: t (7) = 4.242, P = 0.004]. (F) Integrated evaluation of the importance for the targeting brain regions. Frequency: The number of times the brain regions ranked in the top 10 on each index. Size of dots: the average Mean Decrease Gini. (G) Representative images of axonal projections in VP and ZI. Green: EGFP. Scale bar: 250 μm. Dashed lines: outline of brain regions. *P < 0.05, **P < 0.01, ***P < 0.001. Data are shown as mean ± SEM.
Figure 6
Figure 6
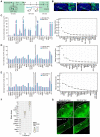
Different molecular features of the VTA Mor-Ens and Shock-Ens. (A) Experimental scheme of purifying ribosome-associated mRNAs and sequencing of the VTA Mor-Ens or Shock-Ens. (B) An MA-plot with the log2-fold changes (Shock-Ens vs Mor-Ens) over the mean of normalized counts. Points with adjusted p-value < 0.05 were colored blue. (C) Heatmap of differentially expressed genes (DEGs: fold change > 1.5 and adjusted p value < 0.05) (Shock-Ens n = 7 sample from 14 mice. Mor-Ens n = 6 sample from 12 mice). (D) Heatmap of differentially expressed genes encoding neuroactive receptors (adjusted p-value < 0.05). (E) Dot plot for DEGs of neuroactive receptors. The size of the dots represents the gene mean counts and the color of the dots represents the adjusted p-value. (F) Dot plot for DEGs involved in GPCRs signaling pathways. The size of the dots represents the gene mean counts; the color of the dots represents the adjusted p-value. (G) The protein-protein interaction networks for the DEGs involved in GPCR signaling pathways were generated from the STRING database (version: 11.5, https://cn.string-db.org). (H) An example of the G protein-coupled receptors (GPCRs) G-protein signaling pathways and GPCRs/β-arrestin/Akt/glycogen synthase kinase 3 (GSK-3) signaling pathway.
Figure 7
Figure 7
The phosphorylated-AKT1Thr308 level is relatively higher in Shock-Ens, while the expression of PLCβ3 is relatively higher in Mor-Ens. (A) Left, schematic of the experimental procedure for the in-situ proximity ligation assay. Right, the working principal diagram of PLA. (B, D) Representative images of PLA signaling for phosphor-AKT1Thr308 or PLCβ3 in the VTA. Green: EGFP; Red: p-AKT1 or PLCβ3. Scale bar: left 100 μm, right 25 μm. Dashed lines: outline of EGFP+ cell. (C, E) The violin plot and cumulative probability curves illustrate the distribution of the PLA signal intensity in each EGFP+ cell. [Mann-Whitney test: (C) Left, Shock-Ens n = 822 cells from 5 mice, Mor-Ens n = 754 cells from 5 mice, U = 240371, P < 0.001; (E) left, Shock-Ens n = 1340 cells from 8 mice, Mor-Ens n = 1415 cells from 8 mice, U = 898116, P = 0.017. Kolmogorov-Smirnov test: (C) right, D = 0.179, P < 0.001; (E) right, D = 0.056, P = 0.026]. *P < 0.05, **P < 0.01, ***P < 0.001. Data are shown as mean ± SEM.
Figure 8
Figure 8
Cariprazine increases the response of the Mor-Ens to sucrose water, while UNC9994 alleviates the response of Shock-Ens to tail suspension. (A) Schematic of fiber photometry recording for VTA ensembles response to 2% (w/v) sucrose water or to tail suspension. The mice were intraperitoneally injected with cariprazine (0.2 mg/kg) or the UNC9994 (0.5 mg/kg) 60 min before the recording. Right, representative images of GCaMP7b expressing in the VTA. Dashed lines: outline of the VTA and optic fiber trace. Green: GCaMP7b; Blue: DAPI. Scale bar: 200 μm. (B, C, F, G) Left, the fiber photometry signal of the VTA ensemble responses to sucrose water. Solid lines represent the mean value. Gray shadows represent SEM. Middle, Area under the calcium photometry curve during sucrose water consumption (0-5 s). [Paired t-test: (B) n = 9, t (8) = -3.494, P = 0.008; (C) n = 8, t (7) = 0.061, P = 0.953; (F) n = 12, t (11) = 1.876, P = 0.087; (G) n = 11, t (10) = 1.984, P = 0.075]. Right, Average peak of photometric signal responses to sucrose water. [Paired t-test: (B) n = 9, t (8) = -2.845, P = 0.022; (C) n = 8, t (7) = -0.712, P = 0.500; (F) n = 12, t (11) = 0.757, P = 0.465; (G) n = 11, t (10) = 1.507, P = 0.163]. (D, E, H, I) Left, the fiber photometry signal of VTA ensembles responses to tail suspension. Solid lines represent the mean value. Gray shadows represent SEM. Right, Area under calcium photometry curve during tail suspension (0-40 s). [Paired t-test: (D) n = 9, t (8) = -1.565, P = 0.156; (E) n = 8, t (7) = -1.396, P = 0.205; (H) n = 10, t (9) = 0.852, P = 0.416; (I) n = 8, t (7) = -3.714, P = 0.008]. *P < 0.05, **P < 0.01, ***P < 0.001. Data are shown as mean ± SEM.
Figure 9
Figure 9
Cariprazine alleviates the anxiety-like behaviors during morphine withdrawal. (A) Schematic of the experimental procedure. C57BL/6 mice were intraperitoneal injected with escalating doses of morphine (10 mg/kg, 20 mg/kg, 40 mg/kg, 60 mg/kg, 80 mg/kg) or an equivalent volume of saline twice a day (9:00 a.m. and 21:00 p.m.) for 5 days. During morphine withdrawal (day 6-12), the mice were received intraperitoneal injections of cariprazine (0.2 mg/kg), UNC9994 (0.5 mg/kg) or saline. On day 13 and day 14, the open field test (OPT) and the elevated plus maze (EPM) test were conducted. (B, C) The 30 min OPT (B) and EPM test (C) in saline group [One-way ANOVA: (B) Saline n = 15, Cariprazine n = 14, UNC9994 n = 15. Left, F treatment × session (2, 43) = 7.151, P = 0.002, Bonferroni post hoc: Saline vs Cariprazine, P = 0.015; UNC9994 vs Cariprazine P = 0.003. Right, F treatment × session (2, 43) = 0.203, P = 0.817; (C) Saline n = 15, Cariprazine n = 14, UNC9994 n = 15. Left, F treatment × session (2, 43) = 2.678, P = 0.081. Middle, F treatment × session (2, 43) = 2.028, P = 0.145. Right, F treatment × session (2, 43) = 2.997, P = 0.061]. (D, E) The 30 min OPT (D) and EPM test (E) in morphine group [One-way ANOVA: (D) Saline n = 14, Cariprazine n = 14, UNC9994 n = 14. Left, F treatment × session (2, 41) = 4.771, P = 0.014, Bonferroni post hoc: Saline vs Cariprazine, P = 0.021; (E) Saline n = 15, Cariprazine n = 14, UNC9994 n = 14. Left, F treatment × session (2, 42) = 1.925, P = 0.159. Middle, F treatment × session (2, 42) = 4.029, P = 0.025, Bonferroni post hoc: Saline vs Cariprazine, P = 0.022. Right, F treatment × session (2, 42) = 5.818, P = 0.006, Bonferroni post hoc: Saline vs Cariprazine, P = 0.010; Saline vs UNC9994 P = 1.000; UNC9994 vs Cariprazine P = 0.026; Kruskal-Wallis H Test: (D) Right, H = 0.457, P = 0.796]. *P < 0.05, **P < 0.01. Data are shown as mean ± SEM.

References

    1. Yang L, Zhao Y, Wang Y, Liu L, Zhang X, Li B. et al. The effects of psychological stress on depression. Curr Neuropharmacol. 2015;13:494–504. - PMC - PubMed
    1. Daviu N, Bruchas MR, Moghaddam B, Sandi C, Beyeler A. Neurobiological links between stress and anxiety. Neurobiol Stress. 2019;11:100191. - PMC - PubMed
    1. Craske MG, Stein MB. Anxiety. Lancet. 2016;388:3048–59. - PubMed
    1. Ressler KJ, Berretta S, Bolshakov VY, Rosso IM, Meloni EG, Rauch SL. et al. Post-traumatic stress disorder: clinical and translational neuroscience from cells to circuits. Nat Rev Neurol. 2022;18:273–88. - PMC - PubMed
    1. Young KS, Sandman CF, Craske MG. Positive and negative emotion regulation in adolescence: links to anxiety and depression. Brain Sci. 2019;9:76. - PMC - PubMed