. 2024 Jan 4:14:1301766.
doi: 10.3389/fimmu.2023.1301766. eCollection 2023.

Humoral and cell-mediated immune responses in HIV-vertically infected young patients after three doses of the BNT162b2 mRNA SARS-CoV-2 vaccine

Affiliations

Humoral and cell-mediated immune responses in HIV-vertically infected young patients after three doses of the BNT162b2 mRNA SARS-CoV-2 vaccine

Claudia Vanetti et al. Front Immunol. .

Abstract

Background: Data on the efficacy of three SARS-CoV-2 mRNA BNT162b2 vaccine doses and the role of previous SARS-CoV-2-infection in enhancing vaccine immunogenicity in HIV-vertically-infected people living with HIV (PLWH) are limited, as is the duration of vaccine-induced responses.

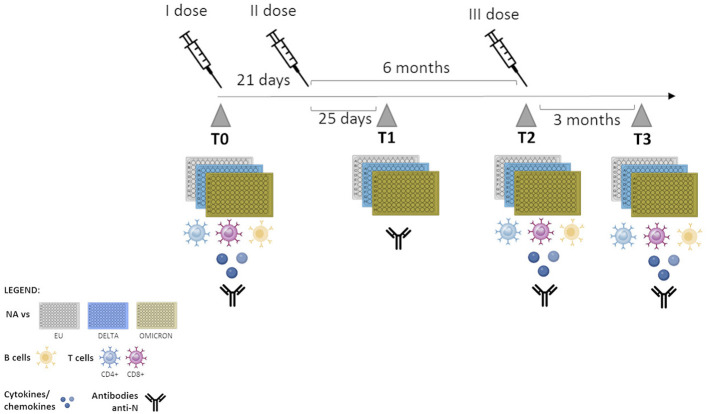
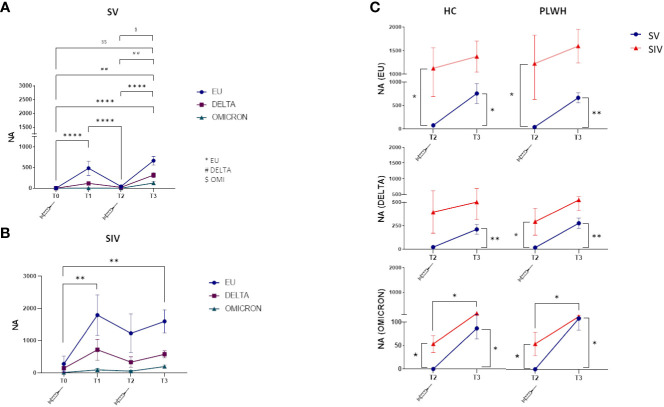
Methods: SARS-CoV-2 plasma neutralizing activity (NA) against the European (B.1), Delta (B.1.617.2) and Omicron (B.1.1.529) variants and cell-mediated immunity (CMI) were analyzed in 29 ART-treated young PLWH (mean age 27.9 years) and 30 healthy controls (HC) who received three BNT162b2 vaccine doses. Individuals were stratified based on the presence/absence of previous SARS-CoV-2 infection (infected and vaccinated -SIV-; uninfected and vaccinated -SV-). Analyses were performed before vaccination (T0), 25 days from the second dose (T1), the day the third dose was administered (T2), and 3 months after the third dose (T3).

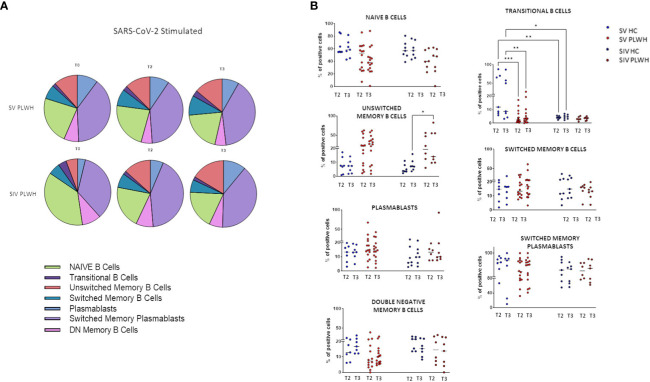
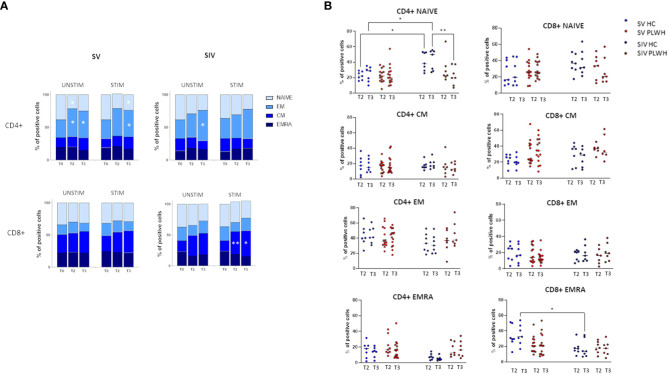
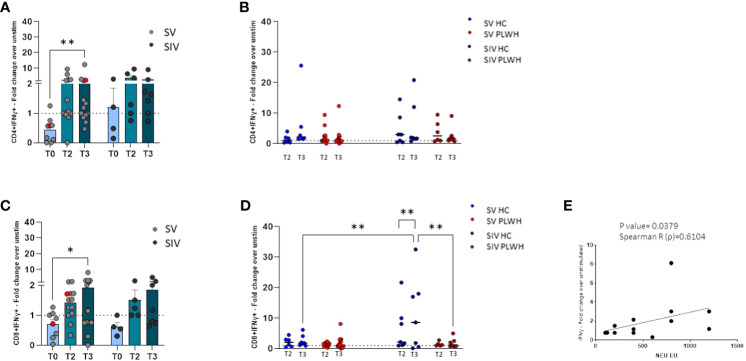
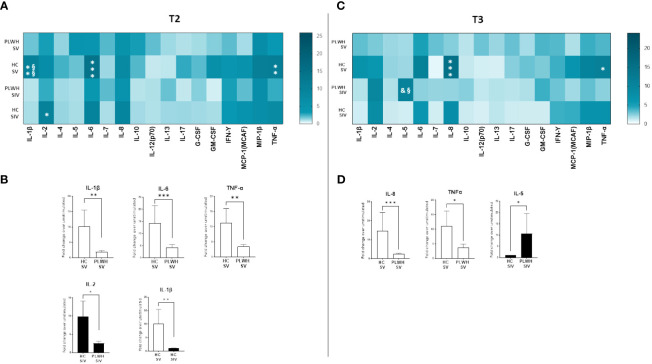
Results: In PLWH: i) NA against all variants was higher in SIV compared to SV at T2 and was increased at T3; ii) switched-memory plasmablasts were augmented in SIV alone at T2 and T3; iii) a SARS-CoV-2 specific T cell memory was generated; iv) IFN-γ-secreting CD4+ and CD8+ T lymphocytes were boosted at T3 mainly in SV. CMI magnitude was reduced in PLWH compared to HC. Notably, after the third dose of vaccine viremia was unmodified, but CD4 T cell counts were reduced>20% in 3/29 PHLW.

Conclusion: A third dose of BNT162b2 vaccine induces strong humoral and CMI responses in young ART-treated PLWH independently from a previous SARS-CoV-2 natural infection. The lower magnitude of CMI responses should be considered when planning mRNA vaccine booster doses in PLWH.

Keywords: COVID-19 SIV individuals; PLWH; SARS-CoV-2 vaccine efficacy; immune response; immunocompromised subjects.


Conflict of interest statement

The authors declare that the research was conducted in the absence of any commercial or financial relationships that could be construed as a potential conflict of interest. The author(s) declared that they were an editorial board member of Frontiers, at the time of submission. This had no impact on the peer review process and the final decision.

Figures

Figure 1
Figure 1
Timeline of sample collection. T0: one day before vaccination; T1: 25 days after the second dose; T2: 6 months after second dose- administration of the third dose, T3: 3 months after the third dose.
Figure 2
Figure 2
Neutralizing activity against EU, Delta and Omicron variants. Plasma neutralizing activity (NA) over time against EU (blue line), Delta (purple line) and Omicron (green line) in SV (A) and SIV (B) PLWH; (C) Comparison in plasma neutralizing activity (NA) between SV (blue line) and SIV (red line) at T2 and T3 against the three variants in HC (left panels) and PLWH (right panels). Mean values ± SEM are reported. Significance was set at P < 0.05 (Two-way ANOVA test, p values adjusted for multiple comparisons). *p<0.05, **p<0.01, ***p < 0.001, ****p < 0.0001; ##p<0.01, ###p < 0.001; $p < 0.05, $$p<0.01.
Figure 3
Figure 3
B-cell phenotypic profile. (A) Pie charts representing the different B cell subsets at T0, T2 and T3 in SV (n=15) and SIV (n=8) PLWH upon SARS-CoV-2 stimulation; mean values are reported. (B) Longitudinal analysis of the frequency (% of positive cells) of B cell subsets at T2 and T3 in SV and SIV HC (blue dots) and PLWH (red dots); interleaved scatterplot graphs depicting median and p-values are reported. Significance was set at P < 0.05 (Two-way ANOVA test, p values adjusted for multiple comparisons). *p<0.05, **p<0.01, ***p < 0.001.
Figure 4
Figure 4
T cell subsets. (A) CD4+ (upper panels) and CD8+ (lower panels) T cells memory subsets in SV (left panels) and SIV (right panels) PLWH in the absence (UNSTIM) or presence (STIM) of a 24 hours in vitro stimulation with SARS-CoV-2 peptides throughout the time; mean and p values to baseline are reported. (B) Longitudinal analysis of the frequency (% of positive cells) of T-cell subsets at T2 and T3 in SV and SIV HC (blue dots) and PLWH (red dots); interleaved scatterplot graphs depicting median and p-values within each group are reported. Significance was set at P < 0.05 (Two-way ANOVA test, p values adjusted for multiple comparisons). *p<0.05, **p<0.01.
Figure 5
Figure 5
T cell-mediated immune response. SARS-CoV-2 specific IFN-γ+ secreting CD4+ (A) and CD8+ (C) T cells represented as fold change over unstimulated in SV (light grey dots) and SIV (dark grey dots) PLWH, and patient #45 (red dots), throughout the time; mean values ± SEM are reported. Longitudinal analysis of the SARS-CoV-2 specific IFN-γ+ secreting CD4+ (B) and CD8+ (D) T cells represented as fold change over unstimulated at T2 and T3 in SV and SIV HC (blue dots) and PLWH (red dots); interleaved scatterplot graphs depicting median and p-values are reported. (E) XY scatter plot that shows the relationship between neutralizing activity against EU variant and SARS-CoV-2 specific IFN-γ+ secreting CD8+ cells in SV PLWH at T3. The scatter plot reports the regression line (black), the Spearman R (ρ) value and the exact two-tailed P-value. Significance was set at P < 0.05. *p<0.05, **p<0.01.
Figure 6
Figure 6
Cytokine and chemokine profiles in SV and SIV PLWH. SARS-CoV-2 specific cytokines and chemokines production overtime from supernatants of PBMCs isolated from PLWH SV and SIV represented as fold change over unstimulated condition and shown as a color scale from white to dark green (Heatmap) (A). Mean values are reported. Significance was set at P < 0.05 (Two-way ANOVA test, p values adjusted for multiple comparisons). *p<0.05 vs T0, **p<0.01 vs T0; § p<0.05 vs T2; §§§ p<0.001 vs T2; & p<0.05 vs PLWH SV T3. Significant SARS-CoV-2 specific cytokines and chemokines represented as fold change over unstimulated condition in SV (B) and SIV (C) PLWH throughout the time. (D) Significant SARS-CoV-2 specific cytokines represented as fold change over unstimulated in SV (white bars) and SIV (black bars) PLWH at T3. Mean values ± SEM are reported. Significance was set at P < 0.05 (One-way ANOVA test, p values adjusted for multiple comparisons). *p<0.05, **p<0.01; ***p < 0.001.
Figure 7
Figure 7
Cytokine and chemokine profiles in PLWH and HC. SARS-CoV-2 specific cytokines and chemokines production from supernatants of PBMCs isolated from SV and SIV PLWH and HC represented as fold change over unstimulated condition and shown as a color scale from white to dark green (Heatmap) at T2 (A) and T3 (C). Mean values are reported. Significance was set at P < 0.05 (Two-way ANOVA test, p values adjusted for multiple comparisons). *p<0.05 vs PLWH, **p<0.01 vs PLWH; ***p < 0.001 vs PLWH; § p<0.05 vs HC SIV; §§ p<0.01 vs HC SIV; & p<0.05 vs PLWH SV. Significant SARS-CoV-2 specific cytokines and chemokines represented as fold change over unstimulated condition in SV (white bars) and SIV (black bars) PLWH or HC at T2 (B) and T3 (D). Mean values ± SEM are reported. Significance was set at P < 0.05 (Student’s t-test). *p<0.05, **p<0.01; ***p < 0.001.
Figure 8
Figure 8
Correlograms of the humoral and cellular immune parameters. Spearman R (ρ) values in SV (upper panels) and SIV (lower panels) PLWH and HC at T2 and T3 are shown from red (−1.0) to blue (1.0); color intensity is proportional to correlation coefficients R. Spearman rank two-tailed P-value was indicated by *p < 0.05, **p < 0.01, and ***p < 0.001.

Similar articles

Cited by

References

    1. Haas EJ, Angulo FJ, McLaughlin JM, Anis E, Singer SR, Khan F, et al. . Impact and effectiveness of mRNA BNT162b2 vaccine against SARS-CoV-2 infections and COVID-19 cases, hospitalisations, and deaths following a nationwide vaccination campaign in Israel: an observational study using national surveillance data. Lancet (2021) 397:1819–29. doi: 10.1016/S0140-6736(21)00947-8 - DOI - PMC - PubMed
    1. Muhsen K, Maimon N, Mizrahi AY, Varticovschi B, Bodenheimer O, Cohen D, et al. . Association of BNT162b2 vaccine third dose receipt with incidence of SARS-coV-2 infection, COVID-19–related hospitalization, and death among residents of long-term care facilities, august to october 2021. JAMA Netw Open (2022) 5:e2219940. doi: 10.1001/jamanetworkopen.2022.19940 - DOI - PMC - PubMed
    1. Sahin U, Muik A, Derhovanessian E, Vogler I, Kranz LM, Vormehr M, et al. . COVID-19 vaccine BNT162b1 elicits human antibody and TH1 T cell responses. Nature (2020) 586:594–9. doi: 10.1038/s41586-020-2814-7 - DOI - PubMed
    1. Woldemeskel BA, Karaba AH, Garliss CC, Beck EJ, Wang KH, Laeyendecker O, et al. . The BNT162b2 mRNA vaccine elicits robust humoral and cellular immune responses in people living with human immunodeficiency virus (HIV). Clin Infect Dis (2022) 74:1268–70. doi: 10.1093/cid/ciab648 - DOI - PMC - PubMed
    1. Morrocchi E, Pighi C, Pascucci GR, Cotugno N, Medri C, Amodio D, et al. . Perinatally human immunodeficiency virus–infected adolescents and young adults demonstrate distinct BNT162b2 messenger RNA coronavirus disease 2019 vaccine immunogenicity. Clin Infect Dis (2022) 75:S51–60. doi: 10.1093/cid/ciac408 - DOI - PMC - PubMed

Publication types

Supplementary concepts